
Charlie Liles at the National Weather Service lays out the factors (sub. or ad req.) that made our winter storm past so special:
Just waitin’ for the bus 1

Coyote Man? (hat tip DCF photo pool, which has been stormalicious these last few days)
More on the Revkin Piece
Matthew Nisbett chimes in on the Revkin piece.
The Canadian John Wesley Powell

In the U.S. western water community, John Wesley Powell is a legend for his insight about the difficulties of building a society in an arid land. But we can be a bit parochial here in the states, so until today I’d never heard of his (sort of) Canadian counterpart, John Palliser.
Palliser explored the northern Great Plains in the 1850s, a region now known as Palliser’s Triangle. According to Michael Collier and Robert Webb, in their book Floods, Droughts, and Climate Change, Palliser “warned that southeastern Alberta and southwester Saskatchewan would not reliably sustain human (i.e., agricultural) life. The land was fundamentall arid, receiveing 400 or fewer millimeters (mm) of rain a year; some years there might as well be no rain at all.”
Like Powell, Palliser found his observations about the problems of aridity swept aside by boosters eager to spread across the continent in ways that ultimately turned out to be unsustainable. The Dust Bowl took impressed its will on the farmers of Palliser’s Triangle, just as it did to the folks beyond Powell’s 100th meridian.
Water Supply Update
It looks yesterday’s premise is holding – despite the extraordinary blanket of white in my backyard, the snowpack in the Rio Grande Basin, source of a big chunk of New Mexico’s water supply, didn’t pick up a whole lot from the Great Storm of ’06.
Tom Pagano, who does the runoff forecasts for us out of the NRCS Portland, Ore., office, has built a handy new tool that provides daily runoff forecast updates. The link gets you to an FTP directory of Excel spreadsheets. Open the one named SummaryOutput.xls to see an overview of the whole data set, then look at the individual spreadsheets for each of the major stream gauges to look at the trends (the naming convention is provided in SummaryOutput.xls). The charts directory has graphics for each gauging station. It’s early in the season yet, but the daily updates can give you a feel for how each storm effects the long term outlook without having to wait for the once-a-month official forecasts. It’s pretty geeky, and Tom’s slapped a caveat at the top of each spreadsheet: “Disclaimer: This is a completely automated unofficial experimental product based on SNOTEL data.” But with that in mind, it’s an incredibly useful tool.
The bottom line: The Rio Grande at Otowi, the central measuring point in New Mexico, only picked up a tiny bit for the storm, while the Pecos and Jemez picked up a lot.
Revkin on the nonskeptical heretics
Andrew Revkin does a nice job in this morning’s New York Times in characterizing those scientists that Roger Pielke Jr. has described as the “nonskeptical heretics”:
A third stance is now emerging, espoused by many experts who challenge both poles of the debate.
They agree that accumulating carbon dioxide and other heat-trapping smokestack and tailpipe gases probably pose a momentous environmental challenge, but say the appropriate response is more akin to buying fire insurance and installing sprinklers and new wiring in an old, irreplaceable house (the home planet) than to fighting a fire already raging.
“Climate change presents a very real risk,” said Carl Wunsch, a climate and oceans expert at the Massachusetts Institute of Technology. “It seems worth a very large premium to insure ourselves against the most catastrophic scenarios. Denying the risk seems utterly stupid. Claiming we can calculate the probabilities with any degree of skill seems equally stupid.”
Update: The discussion is underway in earnest over on Dr. Pielke Jr.’s blog.
Stuff I Wrote Elsewhere
I wandered the airport yesterday chatting up stranded passengers for the paper. My favorites (I know, this sucks, but in a profoundly ironic way) – the couple who drove down from Colorado to Albuquerque, figuring they had a better chance of flying out here than out of Denver:
Ron and Ruth Shaw were supposed to be on a catamaran sailing from Tortola, in the British Virgin Islands, this morning.
They drove to Albuquerque from Monte Vista, Colo., guessing they had a better shot of flying out of Albuquerque than Denver.
They guessed wrong.
Water in the Desert
This is the sort of thing tailor-made for Us Media, and we “people of the year” are in full flower today in Albuquerque.
Storm of 2006: Water Supply Implications
It’ll be another few days before the InterWeb data sources catch up with what the eastern two Four Corners states must call the Big Storm of 2006, but the preliminary data suggests that the water supply implications are less significant than the enormous pile of snow in my Albuquerque backyard might indicate.
Here, in terms of snowfall, December precip, etc., it’s the storm of record.: 16 inches of snow at the official weather station out at the airport, 1.13 inches of snow water equivalent, with reports ranging from 10 inches to 2 feet across the city. For us, that’s epic.
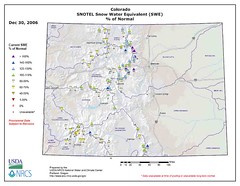
But if you look at the preliminary mountain snowpack numbers, you can see that this storm was not epic everywhere. The nature of the storm, with lots of wrap-around moisture streaming in counter-clockwise around the storm’s center and piling up along the front range in Colorado and mostly east of the continental divide in New Mexico, means that for the big water supply regions, this looks like just a normal winter storm – not at all epic.
The map above is from the NRCS Portland office. Folks there, especially Tom Pagano, have been doing a great job of improving the packaging of the data from their Snotel sites to make it more user-friendly.
How the Storm Played Out

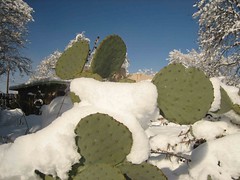
Apologies for those outside of New Mexico for today’s digression, but we’re having a shared experience, a kind of community hug. Snowmen. People walking in the middle of the street because the tire tracks are the easiest place to walk. Cars going slow and being polite about the people walking in the middle of the street. We don’t own snow shovels. This is not part of our ordinary experience, and the extraordinary is, well, extraordinary.
The folks at the National Weather Service have put up a nice page detailing how it played out for those of us interested in the meteorological details.