More on the Hockey Stick

Last year, I wrote about why the assault on (and some of the defense of) the Mann Bradley and Hughes hockey stick was misplaced. With Stephen McIntyre and Ross McKitrick coming out with a new paper, the subject is worth revisiting. But Stefan Rahmstorf has done a much more capable job than I could, so I’ll just leave you in his capable hands:

So let?s assume for argument?s sake that Mann, Bradley and Hughes made some terrible mistake in their statistical analysis, so we need to discard their results altogether. This wouldn?t change our picture of the last millennium (or anything else) very much: independent groups, with different analysis methods, have arrived at similar results for the last millennium. The details differ (mostly within the uncertainty bounds given by Mann et al, so the difference is not significant), but all published reconstructions share the same basic features: they show relatively warm medieval times, a cooling by a few tenths of a degree Celsius after that, and a rapid warming since the 19th Century. Even without Mann et al, we?d still be stuck with a “hockey stick” type of curve ? quite boring.

Would that it were boring, Stefan.

Search Engines

I’m with Clive on this one. He cites the new Pew study on search engine use, which finds: “Most say they could walk away from search engines tomorrow and return to the traditional ways of finding information.” Not me, buddy. You’ll have to pry my search engine from my cold, dead hands.

Uncertainty in the GCM’s

There’s been a lot of noise today about a paper in today’s Nature on the range of uncertainties of future climate change. It’s a terrifically interesting and useful paper, but if you just read the press coverage that I’ve been reading, you may have a rather wrong idea about why.

The researchers, using a Seti@home-like distributed computing system, were able to perform a far larger number of climate model simulation runs than is normally done, and they found that, by using a reasonable but far larger range of the adjustable parameters used in the models, they saw a significantly larger range of possible temperature increase.

The 2,017 simulation runs showed a range of possible temperature increase under doubled atmospheric CO2 of from 2 degrees C to more than 11 degrees C. That’s a bigger range, especially at the top end, than the 1.4 to 5.8 degrees cited by the IPCC. Note – and this is important – that the Oxford team that did the calculations did not say that the high end of the range was the most likely. Quite the opposite. The frequency distribution in their paper suggests the lower end, in the 2 to 4 degree range, is the most likely.

Now let’s look at the press coverage.

First, from The Telegraph: Screen saver weather trial predicts 10 degree C rise in British temperatures

Or MSNBC: “Computer models for climate change allow for a global temperature rise of as much as 20 degrees Fahrenheit (11 degrees Celsius), according to the first results from the world?s largest climate-modeling experiment.” (This accompanied by a map color-coded with the extreme case.)

From The Scotsman: “THE biggest computer calculation of its kind has forecast a degree of global warming greater than previously predicted, with Britain becoming an unrecognisable tropical country in a few generations.”

Even Nature itself, in the Web news story accompanying the paper, fell into the trap: “Biggest-ever climate simulation warns temperatures may rise by 11 C.” (To be fair, Michael Hopkin’s second paragraph gets to the meat: “But as well as a predicting a bigger maximum rise, the project has also increased the range of possible temperature changes.”)

I could find no one who wrote a headline saying “Biggest-ever climate simulation finds temperatures may only rise 2 degrees C,” though that would have been equally well supported by the data.

For a more useful take, without the big number alarmism, there is Newsday’s Bryn Nelson, who did a good job of laying out where this fits and why it matters:

In formulating reasonable global warming predictions, researchers say they have long been stymied by the inherent uncertainty in their models. The climateprediction.net experiment, run by a British research consortium, is trying to address this frustration with a deceptively simple solution: unused computer space.

Calling upon thousands of volunteers to run different versions of the same model with their computers’ spare capacity, the team hopes to refine a long list of atmospheric and oceanic variables. Eventually, the researchers hope to produce a 21st-century forecast that neither over-hypes nor underestimates warming scenarios.

This is an important exercise in helping better understand and refine the range of possibilities, and it’s pretty clear from the research that some of them are extreme and worthy of attention. But a lot of the press coverage I read today makes me think that some of the worst fears of the skeptics crowd about biased media coverage on this issue are not entirely unjustified.
Mountains and Rivers

For our anniversary, Lissa and I bought ourselves a present:


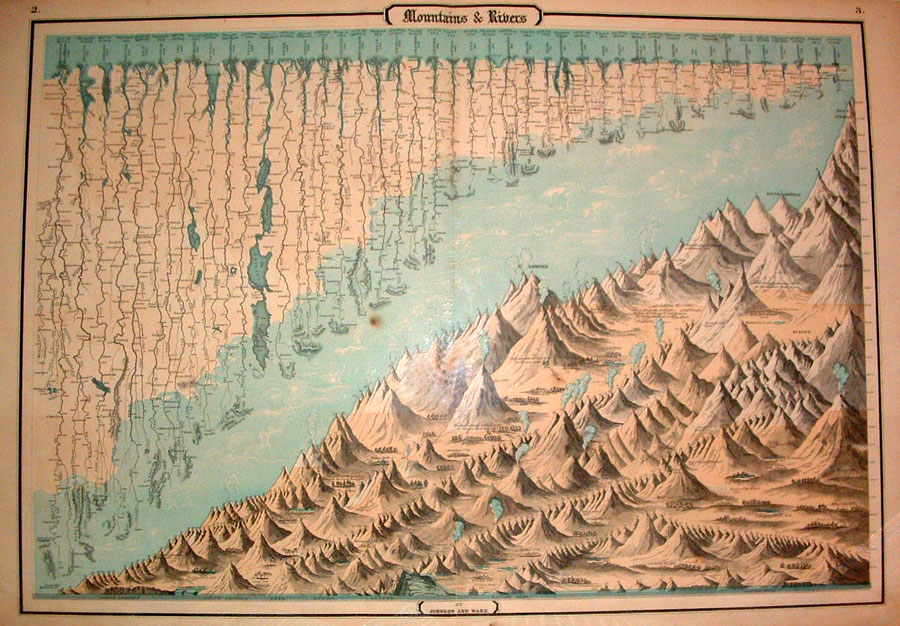
Mountains and Rivers map

It’s “Mountains and Rivers,” from the 1862 Johnson and Ward Illustrated Family Atlas. It is a graphic assemblage of the world’s mountains and rivers, arranged to show their relative sizes, from the mighty Mississippi/Missouri system to the lowly Merrimac.

The Rio Grande is there, flowing out of the Rocky Mountains, past our house and into the Gulf of Mexico. The Colorado River, strangely, is not. (1862 was before John Wesley Powell mapped the Grand Canyon, but by that time people had a pretty clear idea where the thing started and ended.)

The mountains are sadly only numbered, not labeled with names. There must have been a key that went with it which is sadly lost to history. But great passes are named, and high mountain cities, and ecosystems: “Lower limits of the growth of pines in the Torrid Zone, 6,000,” and “Region of Lichens and Umbilicariae.”

It’s a wonderful exemplar of the time – the globe could, for the first time, be looked on as a whole, and the counting and mapping and categorizing of the entire planet could finally be done. There’s such a sense of European optimism in it, as if naming and mapping gave dominion. Seems charmingly naive.

More Carson

From James Wolcott:

His poise, his polish, his precision, were unsurpassed. I was dispatched to LA to catch one of his last shows for Vanity Fair and what struck me sitting in the audience–something that one didn’t come through simply watching at home–was the power of his presence. He was taller than one expected, and when he popped through the curtain, he project a physical force that one didn’t expect.

And let us not forget, Wolcott notes, that Carson “prized science and reason,” bringing Carl Sagan to an audience that might not otherwise have seen him. It was Carson who called Uri Geller’s bluff.

Tang in the Dishwasher

The repairman was by this morning to replace the motor in our dishwasher. He suggested we use Tang every once in a while to keep it clean. Yeah, that Tang. THe powdered drink mix. He said it’s the citric acid.

Kraft doesn’t quite endorse the idea. But they don’t discourage it:

We have heard that some consumers have used TANG? Drink Mix to clean their dishwashers. TANG? does contain citric acid which can act as cleaning agent.

TANG? Drink mix is intended to be a food product and Kraft Foods does not advocate its use for any other purpose.

The Rio Puerco

I had the best intentions today on the bike. I was gonna take it easy. But when the people I was riding with suggested riding to the Rio Puerco (scroll down, you can see the old Rio Puerco bridge). How could I say no?

It’s one of the most beautiful rides in town, climbing out of the Rio Grande Valley up old Route 66 west out of Albuquerque then along a freeway frontage road that rolls along the west mesa before dropping down to the Rio Puerco – the River of Pigs. From the top of the hill, looking down onto the Rio Puerco, you get this classic New Mexico, Georgia O’Keeffe vista, a layer of sandstones marking the far horizon, a dry desert riverbed threading the foreground, the tan slopes in front of you dotted with scraggly piñon.

It was a fun group today, folk I’ve not ridden with before. They go every Sunday. I think I’ll tag along with them again.

RIP

Johnny Carson

I have always enjoyed watching someone who is good at what they do, who is confident and comfortable. I remember standing and talking with the super at my old apartment bulding while he was working on the boiler. He looked at a bolt and reached for the right wrench, without even thinking about which one would fit.

That’s the way Johnny Carson was. I loved that show.

Snowdrops

We have had March weather for the first three weeks of January here in Albuquerque.


snowdrops

Those are snowdrops, peaking up through the detritus of last year’s iris.

When I say “March weather,” I am speaking empirically, not rhetorically. The average overnight low for the first three weeks of January has been 31.3 F here (a tad less than O C). That’s a normal March 1 temperature. Normal for now is more like 23.3 F (-5 C). Daytime highs have been well above normal too, though the gap is a little less. Overall, though, it’s the warmest first three weeks of January in Albuquerque records going back to 1931.

Snowdrops are usually the garden’s first bloomer. But this is ridiculous.

Since I know there are some climate weenies who read this blog, I will self-consciously point out here that I am not making any assertion about global warming having anything to do with my snowdrop. Chalk it up to a persistent ridge of high pressure over the intermountain west. But I would be remiss in not pointing out that the subtext of the numbers above – overnight low temperatures rising more than the daytime highs – is consistent with the anthropogenic hypothesis. This is the “diurnal temperature range”, the gap between day and night temperatures that is one way of fingerprinting greenhouse warming.