New Mexico’s population history, now with added sheeply goodness

In response to my cattle v. people post earlier today, Tom Swetnam asked if I had data for sheep:


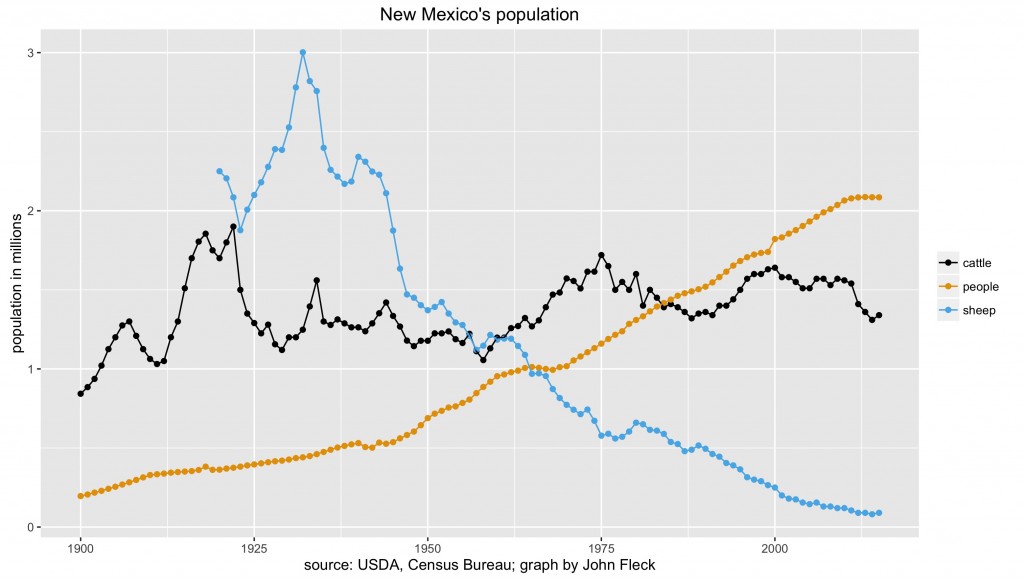
USDA’s data only go back to 1920, but it is as Tom suspected:

the decline of the sheep

the decline of the sheep

New Mexico population (cattle v. people) through history

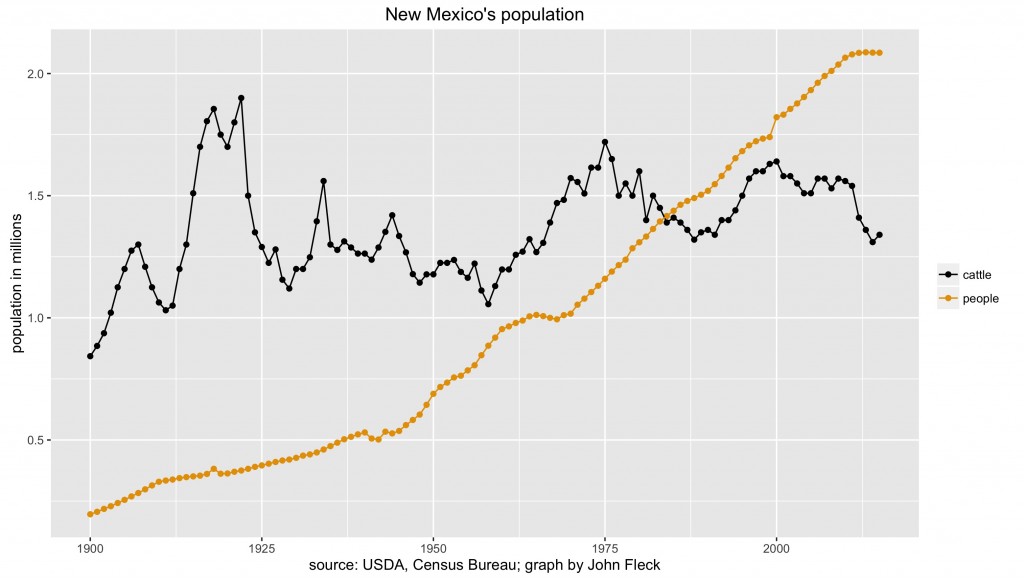
Lauren Villagran’s story in this morning’s Albuquerque Journal about the impact of the Boxing Day blizzard on New Mexico dairies is a reminder of the single most important trend in New Mexico agriculture in the last few decades – the remarkable growth of the state’s dairy industry. Some numbers on that below, but it reminded me of a point that one of my UNM Water Resources Program colleagues likes to make about our state’s history: across the 20th century, cattle outnumbered humans until 1984:

New Mexico cattle, New Mexico humans

New Mexico cattle, New Mexico humans


New Mexico dairy

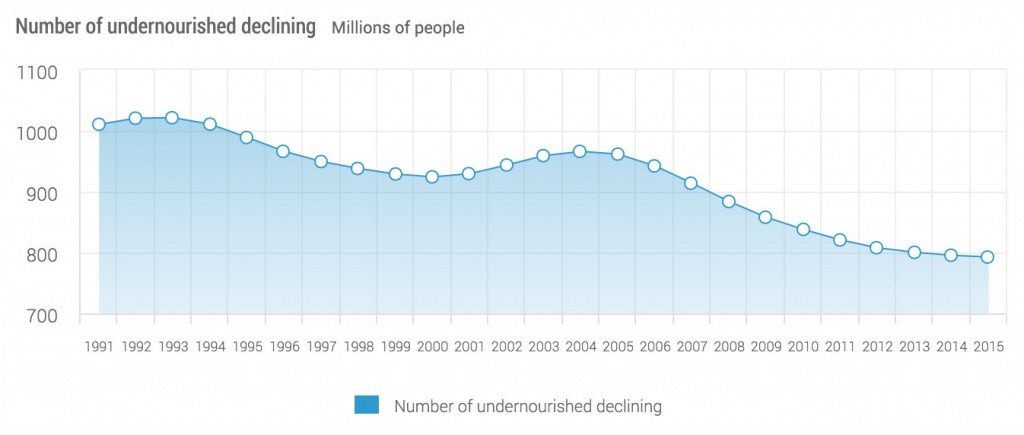
For much of the state’s history, these were beef cattle, but the dairy industry here exploded beginning in the 1990s, with big industrial-scale operations taking advantage of economies of scale:

New Mexico dairy

New Mexico dairy

At $1.8 billion dollars per year in milk sales, dairy is by far the largest component of our agricultural sector. By comparison the largest single crop type, alfalfa, grossed $264 million in 2014. (source)

The dairy family Lauren interviewed are a good example of the scale involved. They run three dairies near Clovis on New Mexico’s east side, with a total of 10,000 producing cows. We’ve heard a widely quoted figure of 30,000 cows killed by the storm, which would be in the neighborhood of 10 percent of the state’s dairy herd, but Lauren’s story notes that’s just a WAG:

An estimate of 30,000 dead cows, quoted widely in the media, is speculative, said Hagevoort, Idsinga and officials with the Farm Service Agency. It is still too early to tell, Hagevoort said.

“That will tell you the extent of the storm,” he said. “We’re still trying to figure out where we’re at. It’s obvious the losses are extensive.”

a note on data and design: Cattle numbers from USDA’s NASS Quick Stats. Census data via FRED. The strange color scheme on the first graph is the colorblind pallet from Jeffrey Arnold’s excellent ggthemes toolkit for R graphics. I’ll be lecturing a bit in the spring semester on data visualization for the UNM Water Resources students, and I’m experimenting.

In Iraq, a problem like the Sacramento Delta, except with actual war

In this week’s Science, Andrew Lawler reports from Basra (paywalled) on problems strikingly similar to the risks in California’s Sacramento-San Joaquin Delta, as upstream water use shuts down a delta river discharge, allowing saltwater intrusion:

The Persian Gulf is creeping relentlessly up rivers and canals shrunken by water diversions upstream and by years of drought. The result is a growing crisis for farmers and the 2.5 million residents of Iraq’s booming southern metropolis of Basra. The rising salinity also threatens attempts to restore the region’s famous marshes—the most extensive wetlands in the Middle East—which nearly disappeared during the reign of Saddam Hussein.

“If we allow nature to take its course, the gulf will move inland,” says Ali Douabul, a marine chemist at the Marine Science Center at the University of Basra.

Preliminary forecast for above average flow on New Mexico’s Rio Grande

With snow on the mountains to the north, the preliminary forecast circulated yesterday by the Natural Resources Conservation Service calls for 11 percent above average flow on the Rio Grande through central New Mexico into Elephant Butte reservoir. This is early in the season, so there are still huge error bars on the numbers, with the 90th percentile possibility at 75 percent above normal (meaning a one in ten chance it’ll be that high) and a 10th percentile forecast (again, one in ten on the low side) that it’ll 55 percent below.

The forecast calls for above average flows on every major river gauge measurement point in the state.

This is the best early season forecast since 2009.

The importance of local knowledge in groundwater management

UC Davis’s Thomas Harter makes an important point in a recent Public Policy Institute of California blog post about California’s evolving effort to manage its groundwater:

The state’s new groundwater law requires locals to form groundwater sustainability agencies and develop sustainability plans, and it will be important for farmers and rural communities to actively engage in that process. Locals have a lot of information and ideas that regulators in Sacramento may never come up with, so working on this issue together is key.

PPIC’s fact sheet is a helpful overview of California’s current groundwater scene.

Turning on Davis Dam, 65 years ago tomorrow

Davis Dam, courtesy USBR

Davis Dam, courtesy USBR

Davis Dam has always been overshadowed by its Lower Colorado River siblings – the scale of Hoover Dam, the striking architecture of Parker Dam, the ability of Imperial Dam to move all that water to the farms to the south and west. Davis mostly generates power, and power generation has always been a bit of a stepchild in western river management. Federal surveyors had scoped out the site, across Pyramid Canyon just upstream of Laughlin and Bullhead City, as early as 1902, but until Hoover Dam was built upstream to knock down the river’s peak flows, there was no point even trying to put a dam there.

It’s named after Arthur Powell Davis, head of the Bureau of Reclamation from 1914 to 1932, and you’ve got to love this old-school Bureau rhetoric explaining just who this Davis fellow was:

Davis was one of a small group of men whose courage, foresight and vision sparked the beginning of Colorado River development.

You can almost hear the patriotic music swelling in the background.

Turning on the power at Davis Dam

Poor Davis Dam, Interior Secretary Oscar Chapman couldn’t be bothered to show up in person, so they rigged a way for him to turn the power plant on by remote control, which he did on Jan. 5, 1951, 65 years ago tomorrow:
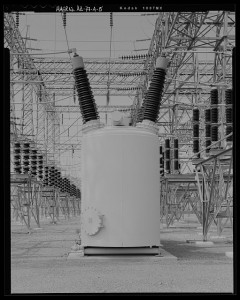
Davis-Mead bay of upper 230-KV switchyard. View west-southwest. - Davis Dam, Switchyards, Southeast of Davis Dam, Kingman, Mohave County, AZ, HAER AZ-77-A-5, courtesy Library of Congress

Davis-Mead bay of upper 230-KV switchyard. View west-southwest. – Davis Dam, Switchyards, Southeast of Davis Dam, Kingman, Mohave County, AZ, HAER AZ-77-A-5, courtesy Library of Congress

On January 5, 1951, Reclamation placed Unit 1 of the Davis power plant into service, when, from his office in Washington, D.C., Secretary of Interior Oscar Chapman pressed a telegraph key that transmitted the signal to Davis Dam, energizing power operations. Two weeks later, Unit 2 started for the first time, but its thrust bearings quickly overheated and the equipment failed. Maintenance crews put Unit 2 back into service by mid-April 1951. The remaining three generating units went on line from mid-April to mid-June 1951. The Davis 230-kV switchyard and transmission lines were fully operating facilities by the end of 1951.

That’s from the Park Service/Interior’s Historic American Engineering Record survey of Davis Dam, pdf. The HAER surveys are a terrific record of our nation’s built environment, and it’s where I often turn (via the Library of Congress photo archive) when I’m looking for photos to illustrate blog posts.
California wetting up, Colorado Basin will have to wait

CFS January, courtesy Levi Cowan

CFS January, courtesy Levi Cowan

My California water friends are breathing a tiny bit easier, as an El Niño-fueled jet stream queues up a series of storms for the parched state. But the latest forecast models suggest the Colorado River Basin is going to have to wait its turn.

The invaluable Daniel Swain wrote a couple of days ago about the storm track pointed California’s way:

The large-scale atmospheric shift I’ve been referencing in nearly every blog post from the past 6 months has finally materialized, and will make itself known in California as early as this weekend….

This is the classic El Niño pattern that I have discussed in previous posts, with a powerful Pacific jet aimed either directly at or south of California.

(If you’re a water nerd and not reading Swain, bookmark him, his weather stuff is for me must read.)

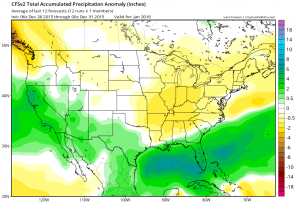
Above is the precipitation anomaly map for January from NOA’s Climate Forecast System model. Green means wetter than average. Yellows are drier than average. You can see a classic El Niño pattern here – wet south, dry north.

Importantly, much of the snowmaking bits of the Colorado Basin are in that colorless limbo, neither wet nor dry. That’s why El Niño isn’t a strong predictor for the Colorado River one way or the other – it’s in the middle, spanning wet south and dry north during El Niño years.

CFS March

CFS March, courtesy Levi Cowan

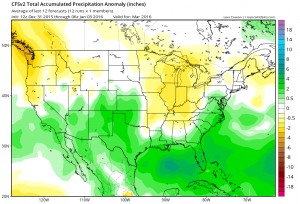
The latest CFS forecast runs, however, suggest that pattern could shift as we move toward spring. Here’s March, with the wet anomalies spilling north into Colorado and Utah. The CFS points in that direction through spring and into summer, forecasting wetter than average weather over much of the Colorado River Basin into August.

And here in New Mexico? Yeah, those maps have me smiling.

The Chicago Sanitary and Ship Canal

Michael McGuire reminds us that today is the 116th anniversary of one of the great milestones in the push toward clean and safe drinking water in the urbanized world – the opening of the Chicago Sanitary and Ship Canal. This allowed Chicago to dump its sewage into the Mississippi River rather than Lake Michigan, from whence Chicago’s drinking water came. This seemed like a great idea to the Chicagoans. Not so much to the folks in St. Louis, 357 miles downstream:

The total travel distance for the sewage from its generation to St. Louis intake was about 357 miles. Missouri sued Illinois to plug the connection to the Mississippi River, also called the Sanitary and Ship Canal, which they claimed was contaminating the St. Louis water supply and increasing the incidence of typhoid fever in that community.

I recommend McGuire’s piece, which traces the legal wrangling. Getting to the point where our tap water’s safety can be mostly taken for granted was a long struggle, and this is one of its important sagas.