The importance of local knowledge in groundwater management

UC Davis’s Thomas Harter makes an important point in a recent Public Policy Institute of California blog post about California’s evolving effort to manage its groundwater:

The state’s new groundwater law requires locals to form groundwater sustainability agencies and develop sustainability plans, and it will be important for farmers and rural communities to actively engage in that process. Locals have a lot of information and ideas that regulators in Sacramento may never come up with, so working on this issue together is key.

PPIC’s fact sheet is a helpful overview of California’s current groundwater scene.

Turning on Davis Dam, 65 years ago tomorrow

Davis Dam, courtesy USBR

Davis Dam, courtesy USBR

Davis Dam has always been overshadowed by its Lower Colorado River siblings – the scale of Hoover Dam, the striking architecture of Parker Dam, the ability of Imperial Dam to move all that water to the farms to the south and west. Davis mostly generates power, and power generation has always been a bit of a stepchild in western river management. Federal surveyors had scoped out the site, across Pyramid Canyon just upstream of Laughlin and Bullhead City, as early as 1902, but until Hoover Dam was built upstream to knock down the river’s peak flows, there was no point even trying to put a dam there.

It’s named after Arthur Powell Davis, head of the Bureau of Reclamation from 1914 to 1932, and you’ve got to love this old-school Bureau rhetoric explaining just who this Davis fellow was:

Davis was one of a small group of men whose courage, foresight and vision sparked the beginning of Colorado River development.

You can almost hear the patriotic music swelling in the background.

Turning on the power at Davis Dam

Poor Davis Dam, Interior Secretary Oscar Chapman couldn’t be bothered to show up in person, so they rigged a way for him to turn the power plant on by remote control, which he did on Jan. 5, 1951, 65 years ago tomorrow:

Davis-Mead bay of upper 230-KV switchyard. View west-southwest. - Davis Dam, Switchyards, Southeast of Davis Dam, Kingman, Mohave County, AZ, HAER AZ-77-A-5, courtesy Library of Congress

Davis-Mead bay of upper 230-KV switchyard. View west-southwest. – Davis Dam, Switchyards, Southeast of Davis Dam, Kingman, Mohave County, AZ, HAER AZ-77-A-5, courtesy Library of Congress

On January 5, 1951, Reclamation placed Unit 1 of the Davis power plant into service, when, from his office in Washington, D.C., Secretary of Interior Oscar Chapman pressed a telegraph key that transmitted the signal to Davis Dam, energizing power operations. Two weeks later, Unit 2 started for the first time, but its thrust bearings quickly overheated and the equipment failed. Maintenance crews put Unit 2 back into service by mid-April 1951. The remaining three generating units went on line from mid-April to mid-June 1951. The Davis 230-kV switchyard and transmission lines were fully operating facilities by the end of 1951.

That’s from the Park Service/Interior’s Historic American Engineering Record survey of Davis Dam, pdf. The HAER surveys are a terrific record of our nation’s built environment, and it’s where I often turn (via the Library of Congress photo archive) when I’m looking for photos to illustrate blog posts.

California wetting up, Colorado Basin will have to wait

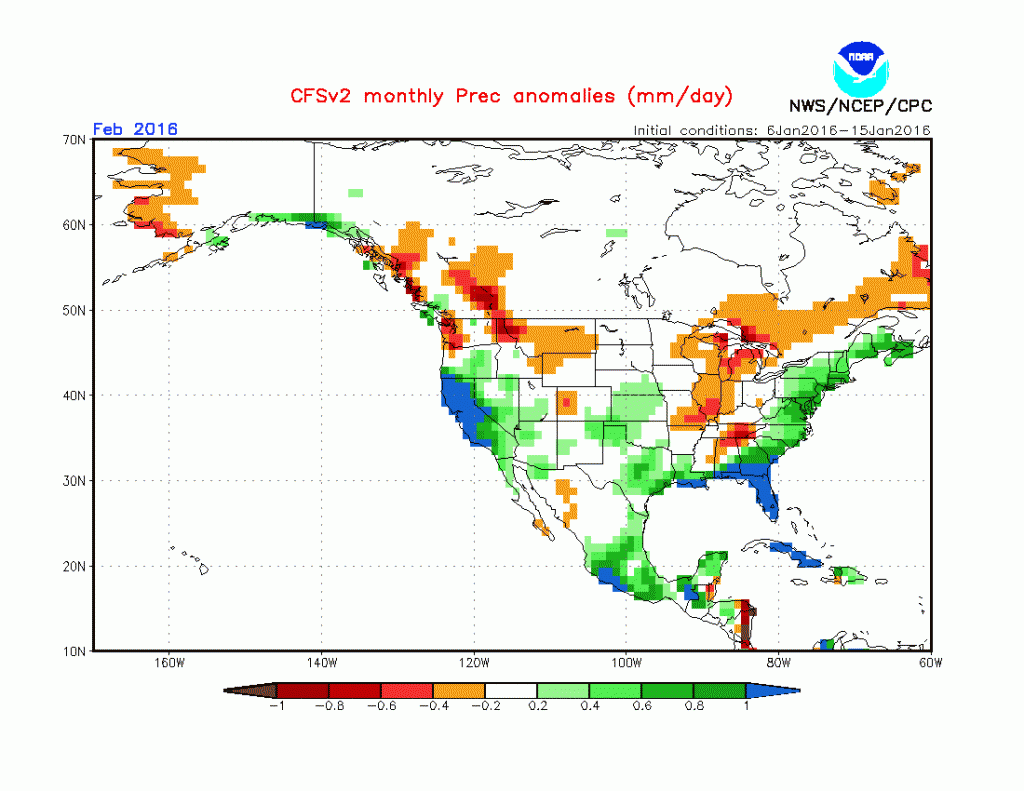
CFS January, courtesy Levi Cowan

CFS January, courtesy Levi Cowan

My California water friends are breathing a tiny bit easier, as an El Niño-fueled jet stream queues up a series of storms for the parched state. But the latest forecast models suggest the Colorado River Basin is going to have to wait its turn.

The invaluable Daniel Swain wrote a couple of days ago about the storm track pointed California’s way:

The large-scale atmospheric shift I’ve been referencing in nearly every blog post from the past 6 months has finally materialized, and will make itself known in California as early as this weekend….

This is the classic El Niño pattern that I have discussed in previous posts, with a powerful Pacific jet aimed either directly at or south of California.

(If you’re a water nerd and not reading Swain, bookmark him, his weather stuff is for me must read.)

Above is the precipitation anomaly map for January from NOA’s Climate Forecast System model. Green means wetter than average. Yellows are drier than average. You can see a classic El Niño pattern here – wet south, dry north.

Importantly, much of the snowmaking bits of the Colorado Basin are in that colorless limbo, neither wet nor dry. That’s why El Niño isn’t a strong predictor for the Colorado River one way or the other – it’s in the middle, spanning wet south and dry north during El Niño years.

CFS March

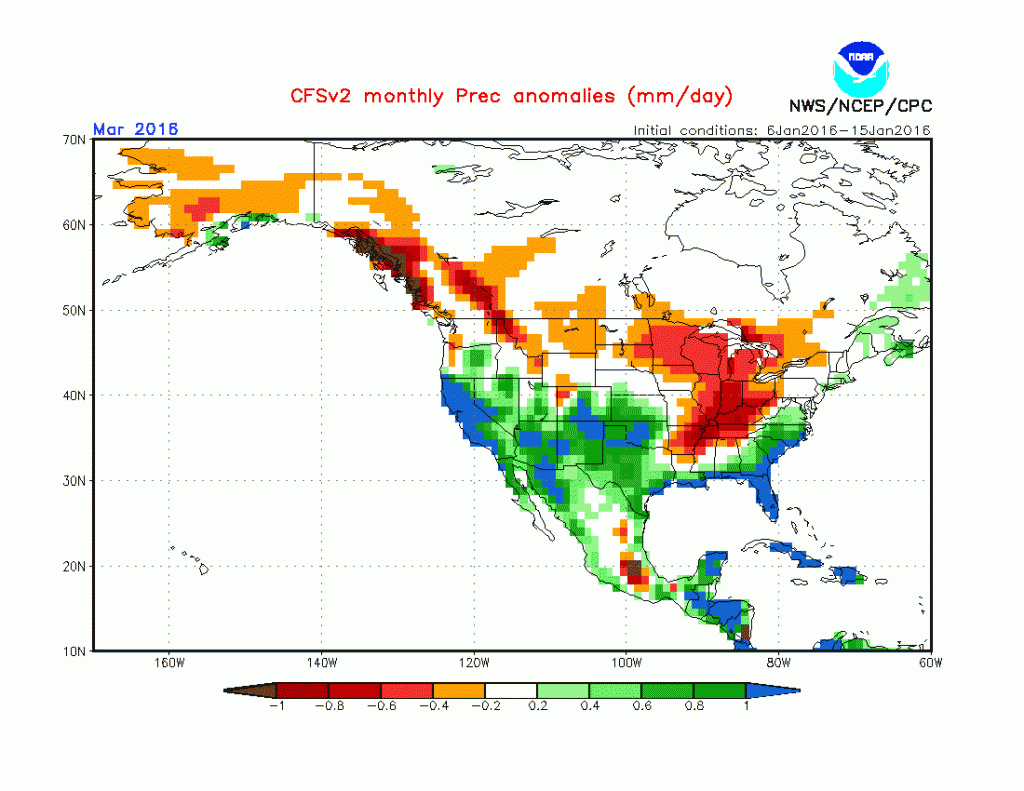
CFS March, courtesy Levi Cowan

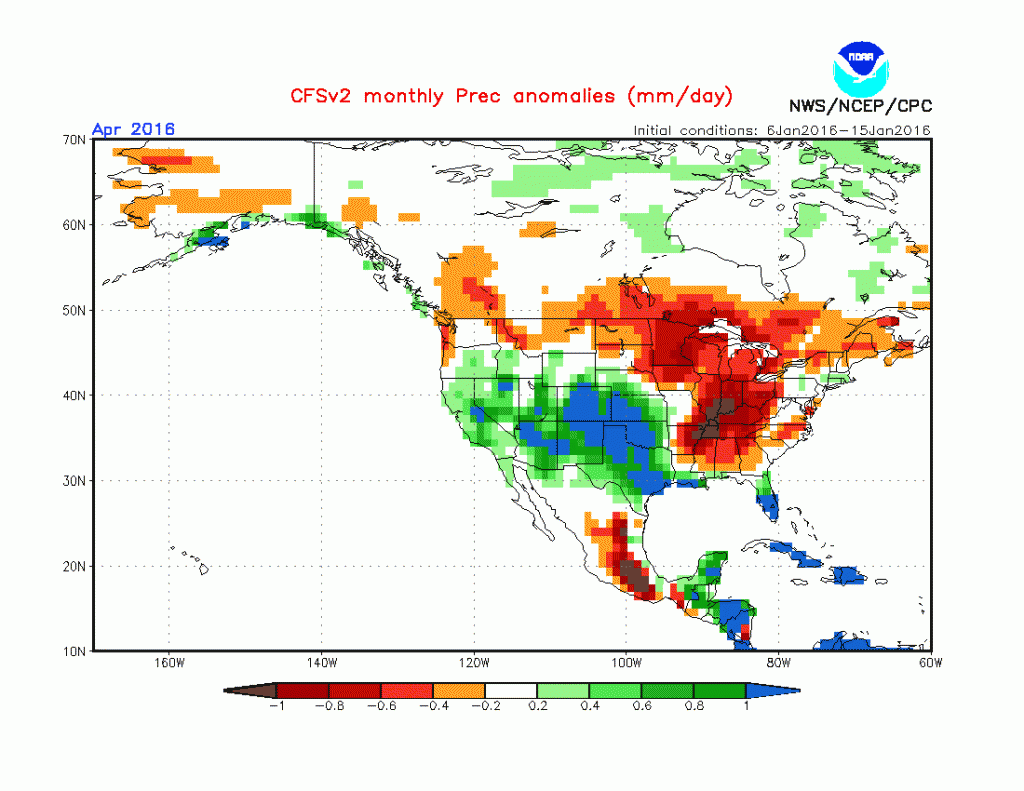
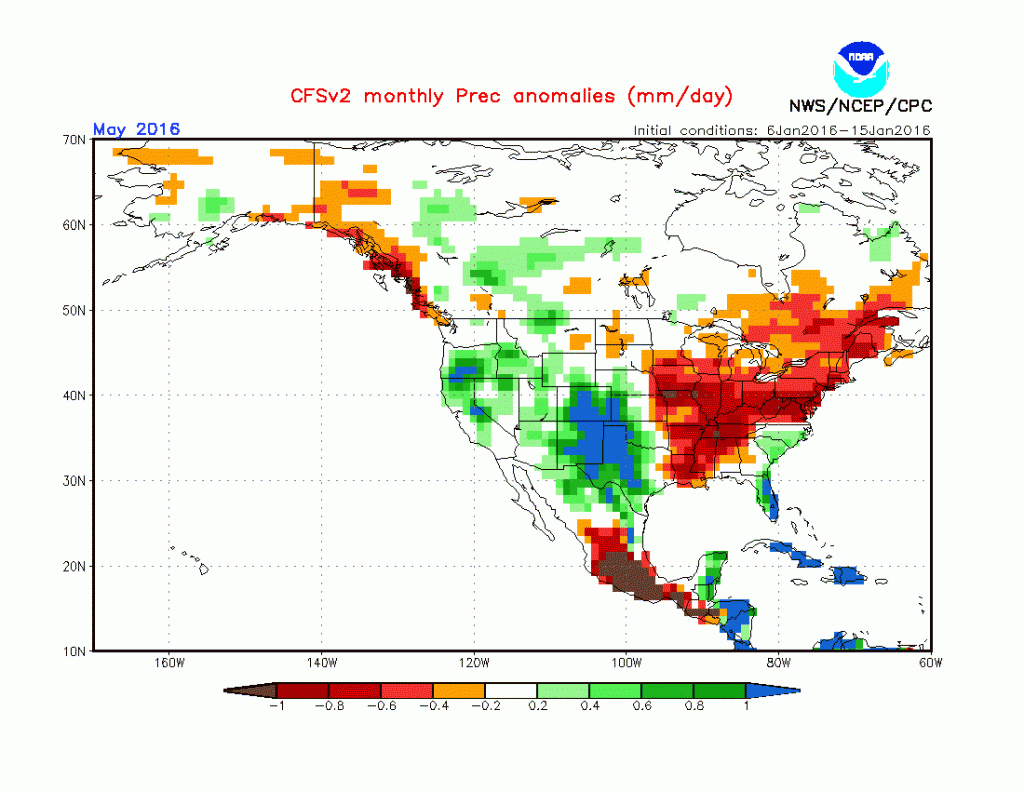
The latest CFS forecast runs, however, suggest that pattern could shift as we move toward spring. Here’s March, with the wet anomalies spilling north into Colorado and Utah. The CFS points in that direction through spring and into summer, forecasting wetter than average weather over much of the Colorado River Basin into August.

And here in New Mexico? Yeah, those maps have me smiling.

The Chicago Sanitary and Ship Canal

Michael McGuire reminds us that today is the 116th anniversary of one of the great milestones in the push toward clean and safe drinking water in the urbanized world – the opening of the Chicago Sanitary and Ship Canal. This allowed Chicago to dump its sewage into the Mississippi River rather than Lake Michigan, from whence Chicago’s drinking water came. This seemed like a great idea to the Chicagoans. Not so much to the folks in St. Louis, 357 miles downstream:

The total travel distance for the sewage from its generation to St. Louis intake was about 357 miles. Missouri sued Illinois to plug the connection to the Mississippi River, also called the Sanitary and Ship Canal, which they claimed was contaminating the St. Louis water supply and increasing the incidence of typhoid fever in that community.

I recommend McGuire’s piece, which traces the legal wrangling. Getting to the point where our tap water’s safety can be mostly taken for granted was a long struggle, and this is one of its important sagas.

2015 puts Sierra Nevada-Colorado Basin linkage in stark relief

If you care about Colorado River Basin water, it behooves you to pay attention to the snowpack in California’s Sierra Nevada. It’s an entirely different watershed, but 2015 demonstrated how the interconnections in California’s plumbing have left the two inextricably linked.

The tl;dr version of two interrelated points below:

  • California’s drought has put pressure on the Colorado River, as Southern California turns east for more water to make up for shortfalls from the north.
  • Despite California’s problems, the overall Colorado River Basin is holding up – able in a subpar year on the Colorado to deliver the extra water to L.A. and San Diego while ending the year with total reservoir storage unchanged from last year at this time. The system is in a tenuous but encouraging balance.

California, the Colorado, and the West’s interlocking watersheds

7 -day accumulated snow, GFS model, courtesy Levi Cowan

7 -day accumulated snow shows more help on the way for California’s watersheds. GFS model, courtesy Levi Cowan

The good news in California is that, as of yesterday’s theatrical, made-for-media first measurements of the year, the Sierra snowpack is near normal for this time of year. That’s essentially twice as much snow as last year at this time. There’s lots of snow season left to push the numbers up or down, but for now it’s good news. And the current forecasts (see map to the right) call for more of the same.

Less theatrical is the Metropolitan Water District of Southern California’s low key success in running its Colorado River Aqueduct full bore this year, ferrying extra water from Lake Mead to coastal Southern California to make up for the shortfall in 2015 Sierra-fed water supplies. In particular, in addition to Met’s flexibility in water deals within California to move ag water to meet urban demand during the drought, there is 240,333 acre feet of water moving through the aqueduct that would not otherwise be there thanks to a historic 150kaf deal to send Las Vegas water Met’s way to help during the drought, plus another 90,333 acre feet in water that Met had banked in Lake Mead in previous years.

The result is that, at 1.178 million acre feet, Met’s take on the Colorado River this year is projected to be the largest since 2002 (source: USBR water accounting reports, 2015 year-end forecast updated today).

There are two ways of looking at this.

Water use by the Imperial Irrigation District. Data: USBR, graph by John Fleck

Water use by the Imperial Irrigation District. Data: USBR, graph by John Fleck

The foresight of Southern California’s water management community created diverse sources of supply that have allowed it to weather the unprecedented California drought. One purpose of big multi-year reservoirs is to store water in wet times so that it is available in dry times. Lake Mead has fulfilled that role, dramatically, during California’s current drought. That is a good thing. What good is a reservoir full of water if you can’t tap it when you’re faced with an event as extreme as California’s current drought?

California also has been building increasingly sophisticated water-sharing/transfer deals, including between the Imperial Irrigation District (where water use in 2015 was at record low levels) and metro water agencies.

But risk in California now poses risk in the rest of the Colorado River Basin, because of the interconnections we’ve built. My water supply here in Albuquerque, beyond the eastern  boundary of the hydrologic Colorado River Basin, is now linked to snow that falls in California’s Sierra Nevada nearly 1,000 miles (600 1600 km) away.

Why 2015 nevertheless leaves me optimistic about about the Colorado

When I sat down this morning to look at 2015 Colorado River data with an eye toward a year end post, here is what struck me.

  • The last water year was a bit below average (94 percent at Lake Powell).
  • Current total system storage of 29.7 million acre feet is essentially exactly the same as last year at this time. (source)

So in a slightly sub-par year, and with California taking extra water in response to a historic drought, the Colorado River system remained, in 2015, roughly in balance. Absent California’s problems, net storage would have been up this year.

Importantly, with just 94 percent river flow, Lake Powell is up ~300,000 acre feet from a year ago, suggesting that Upper Colorado River Basin water users consumed less water than nature provided. Mead is down, Powell is up.

Of course, “absent California’s problems” invokes a useless hypothetical, because California did have problems. I could just as easily pose a hypothetical in the opposite direction: What if we hadn’t had that “miracle May” that bailed out an otherwise dismal year in the basin?

Elephant Butte Reservoir, 2015

Elephant Butte Reservoir, the largest on the Rio Grande, will end 2015 with roughly 322,000 acre feet of water, or about 16 percent full. That’s up from 11.5 percent last year at this time:

Year-end Elephant Butte storage

Year-end Elephant Butte storage

Elephant Butte provides water, primarily for irrigation, for southern New Mexico, Texas, and northern Mexico. When Elephant Butte is short, as it has been most recent years, farmers shift to groundwater for their permanent crops (especially pecans) and fallow some of their field crops.

This graph shows the depth and duration of what we call “the drought of the 1950s”. You can see that it really began in the 1940s and we didn’t really pull out of it until the late 1970s. It was a badass.

A reader recently asked the potential impact of a good snowpack this year on the Butte. This graph shows how it took a series of almost entirely good years from 1974 to 1982, with only one bad year mixed in, to refill the reservoir. It’s really big.

Data courtesy USBR water ops.

update: this post was updated to correct a typo on the amount of water in Elephant Butte. 322kaf, not 232kaf

People on wells less likely to view water management as a shared problem

This is fascinating:

A survey finds correlations between utilizing an individual water source (e.g. well or spring) and attitudes toward water management and conservation. Compared to respondents with a shared water source, those with an individual source believe they are segregated from regional water concerns. They are less willing to pay for water management or conservation measures and less supportive of any government intervention in water management. These results suggest that planners and water managers may face resistance to conservation policies or any policy based on the idea of water as a common pool resource. (emphasis added)

That’s from “Individualized water source as an indicator of attitudes about water management and conservation in humid regions” by Kristan Cockerill, Peter A. Groothuis, Tanga McDaniel Mohr, and Courtney Cooper in the Journal of Environmental Planning and Management. (I’ve only read the abstract, my university library doesn’t have a subscription.)


Sierra Madre, CA, introduces Colorado River water, winds up with “the Tucson problem”

Water is just water, right? What happened when Sierra Madre, a suburb northeast of Los Angeles, switched from local groundwater to imported Colorado River water is a reminder that, well, no:

In 2013, Sierra Madre was forced to begin importing water from the Metropolitan Water District. That led to a new problem. The water source has a different chemistry, temperature and disinfecting agent than the groundwater supply. That started taking a toll on the city’s aging infrastructure.

Residents began to see yellow, foul-smelling water coming from their taps ? the result of iron oxide being released from the inside of old pipes.

When water pipes acclimated to water of a certain pH suddenly get water of a different pH, the chemistry of degunking the inside of the pipes can be a bit of a mess. This is what happened in in the early 1990s when Tucson made a similar switch, as Mitch Basefsky wrote some years ago in Southwest Hydrology (pdf):

Almost immediately following the initial delivery of Colorado River water, the utility began receiving complaints about water that was discolored, smelly, foultasting, or contained rust. Analyses showed that the water contained high levels of iron and other corrosion byproducts from metallic water mains and private plumbing. In essence, the aggressive water was releasing existing corrosion and scale from the pipe walls.