Monthly weather report, May 2014

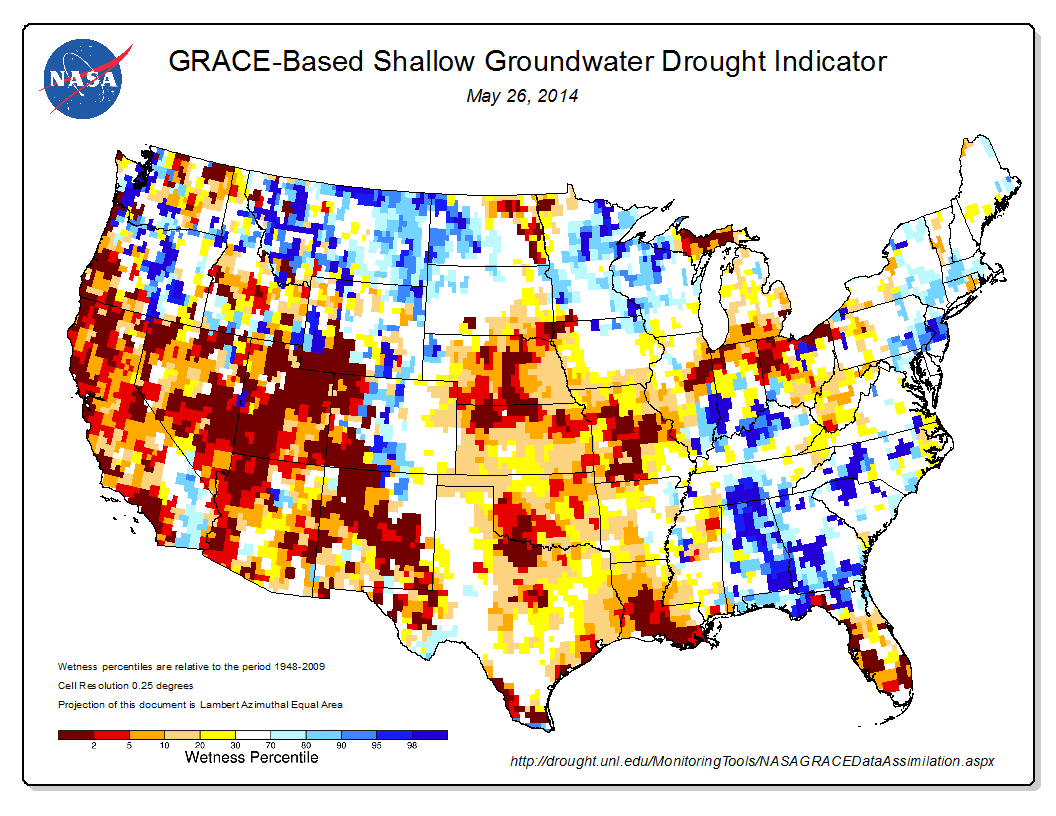
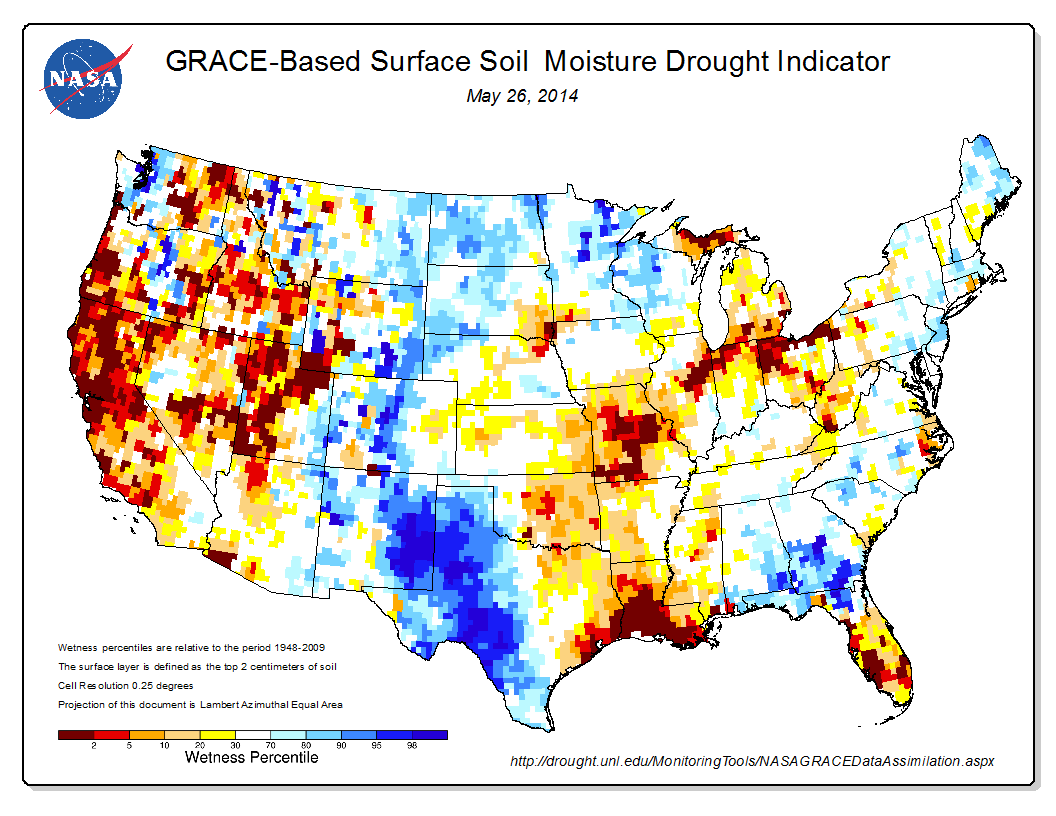
satellite-derived soil moisture estimates, based on NASA GRACE data, courtesy National Drought Mitigation Center

satellite-derived soil moisture estimates, based on NASA GRACE data, courtesy National Drought Mitigation Center


Poking in the garden this morning, I’d never have guessed without actual rain gauge data that we just finished a wet month. It’s really dry out there. But drought is a funny thing, eh? 0.55 inches (1.4 cm) of rain at our house in May was the first above-average month since November. My total now stands at 2.91 inches (7.4 cm) for the water, year (the period beginning last Oct. 1). That is 59 percent of the mean for my house (per PRISM data). The soil’s just always dry at this time of year in New Mexico, I guess.

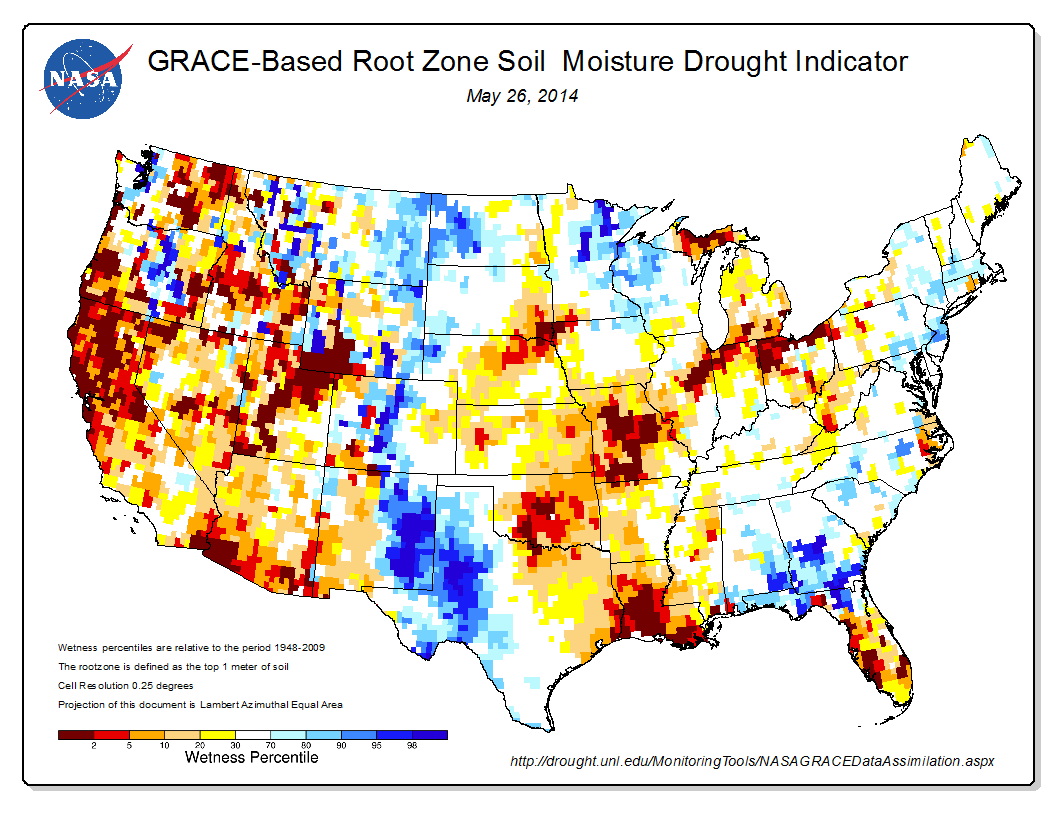
I live right in that area of white pixels in the north-central part of the state in the map above, which is an experimental attempt at using satellite data from NASA’s GRACE to estimate moisture at various depths – and at various levels of importance to measuring drought. Here’s the root zone map, a variable of interest to the plants in my garden:

root zone moisture

satellite-derived root zone moisture estimates, based on NASA GRACE data, courtesy National Drought Mitigation Center

But here’s why drought’s a very difficult thing to write about in the newspaper. It’s one word – “drought” – but a range of phenomena, depending on how you use water. Let’s say you depend, not on soil moisture in the root zone, but on groundwater:

groundwater

satellite-derived root zone moisture estimates, based on NASA GRACE data, courtesy National Drought Mitigation Center

Yowza.

That looks like a nice place for a dam!

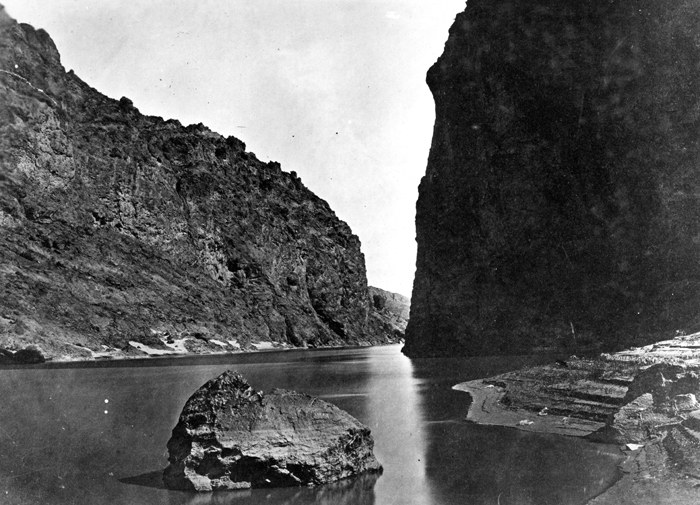
Black Canyon on the Colorado River, from the 1871 Wheeler survey, courtesy USGS. This is the area eventually chosen some years later for what was called Boulder or Hoover Dam:

Black Canyon of the Colorado River, looking below from Camp 7 in Nevada. Photo by T.H. O'Sullivan.U.S. Geographical Surveys West of the One Hundredth Meridian (Wheeler Survey, 1871 Expedition).

Black Canyon of the Colorado River, looking below from Camp 7 in Nevada. Photo by T.H. O’Sullivan.U.S. Geographical Surveys West of the One Hundredth Meridian (Wheeler Survey, 1871 Expedition).

Has desal drought-proofed Israel?

Another example of reasons to be optimistic about our water future?

With just half its normal precip last winter, Israel is in what might properly be characterized as a meteorological drought this year. But not to worry, according to this AP report:

Tenne said the country has managed to close its water gap through a mixture of conservation efforts, advances that allow nearly 90 percent of wastewater to be recycled for agricultural use and, in recent years, the construction of desalination plants.

Since 2005, Israel has opened four desalination plants, with a fifth set to go online later this year. Roughly 35 percent of Israel’s drinking-quality water now comes from desalination. That number is expected to exceed 40 percent by next year and hit 70 percent in 2050.

The turkey vultures of Mesa Verde

Six turkey vultures roosting at Spruce Tree House, Mesa Verde, May 2014, by John Fleck

Six turkey vultures roosting at Spruce Tree House, Mesa Verde, May 2014, by John Fleck

Five years ago, Lissa and I stopped to talk to a ranger on the Petroglyph Point Trail at Mesa Verde. We’d been admiring the turkey vultures soaring above the canyon, and the ranger clued us in. If you like turkey vultures, she told us, go to the Spruce Tree House overlook at dusk tonight and you’ll see a whole bunch of ’em coming in to roost.

We did, and Oh My. That year, I think it was in July, we counted more than a hundred at one time. They soared in a few at a time – one, two, three, four – over a period of hours. They’d sit on the cliff opposite, warming their wings in the setting sun, before settling in for the night, one at at time, in the trees in the canyon below Spruce Tree House. It was a life experience. That summer, we detoured on our return from vacation to see it again.

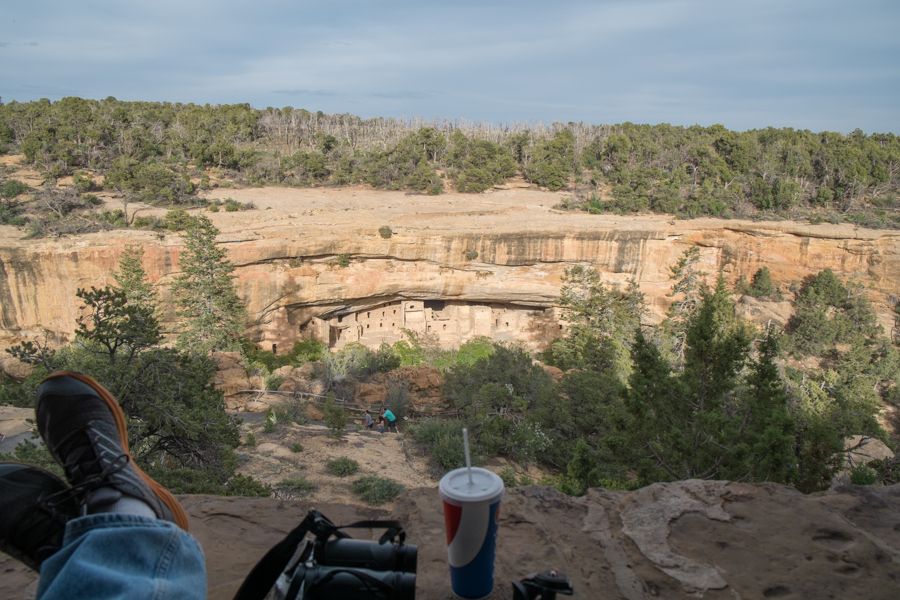
So this year, on vacation in the same territory earlier this month, we went back. After a dinner of Navajo tacos at the cafeteria, we perched on the porch on the back of the ranger station, overlooking Spruce Tree House, and waited.
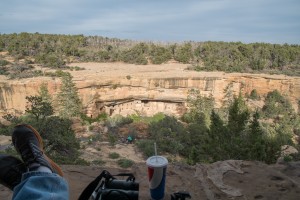
Vulture-watching perch, Spruce Tree House, Mesa Verde, May 2014

Vulture-watching perch, Spruce Tree House, Mesa Verde, May 2014

Turkey vultures or not, it’s a lovely spot. We brought all the glass we had at our disposal – two cameras, two pair of binoculars. And snacks and drinks.

This year, the rangers had a second clue for us. While it was still early in the season (only a few dozen turkey vultures had arrived, they said), the Mesa Verde birds had added a routine to their show. At dusk, the rangers explained, turkeys who lived in the woods atop the cliff would walk out, one at a time, perch on the cliff, and then fly clumsily in a downward path (these are turkeys, remember) toward the trees the vultures had staked out for them.
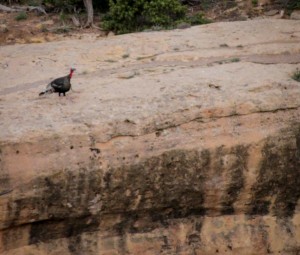
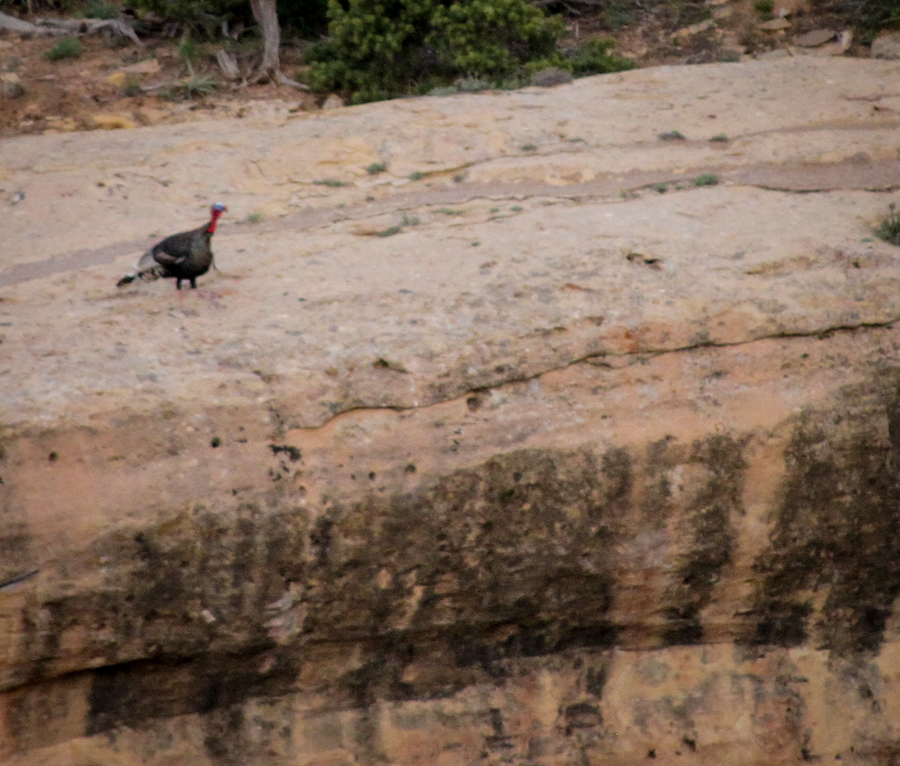
Turkey, staring into the abyss, by L. Heineman, May 2014

Turkey, staring into the abyss, by L. Heineman, May 2014

We had at least two hours of vultures coming and going in small numbers, with a few roosting in the trees, before the first turkey showed. It was hilarious. It walked out of the woods opposite along the hiking rail, where the humans go. It wandered off to the north, then a second showed, and eventually one of the turkeys walked out to the edge of the cliff.

Turkeys are not known for the ability to fly, and it showed. It was more a leap, a clumsy flapping, and then a no-turning-back landing. If there was already a vulture on the chosen tree branch, tough shit. The vultures were hip to this routine, and seemed to understand that the turkeys didn’t have a lot of maneuverability. The vultures moved.

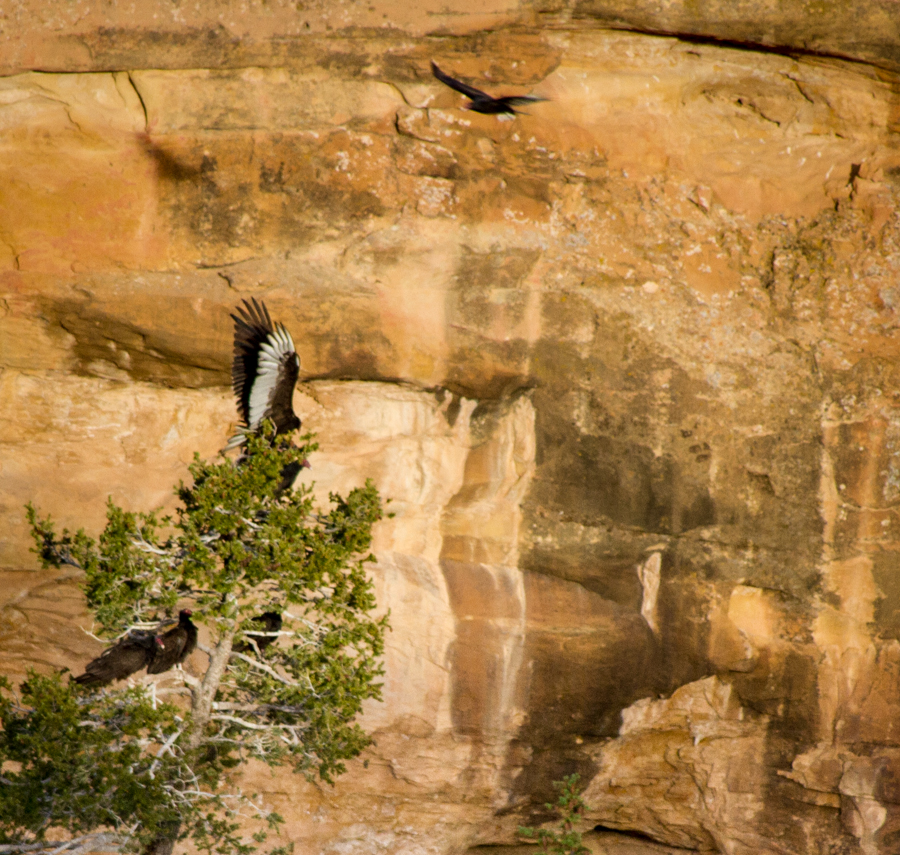
It was dusk, and neither of us had the lenses to really capture the comically remarkable turkey vulture flight in the low light, but it was a treat. Eventually, six turkeys had joined the vultures in the trees by the time it got too dark to see any more. This one will have to do, and you’ll just have to take my word for the fact that this is a turkey, flying downhill from the top of a cliff toward a tree, and that watching them pull off this stunt added, if that is possible, to the life experience of vultures at Spruce Tree House:
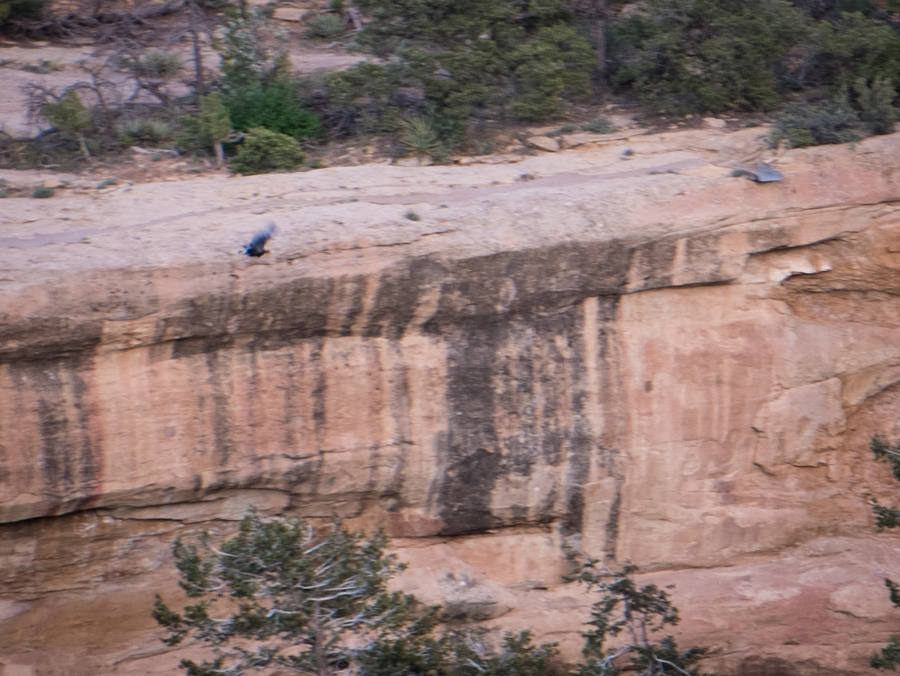
Turkey, taking flight to its Spruce Tree House roost, May 2014
Turkey, taking flight to its Spruce Tree House roost, May 2014
Lake Mead: lowest end-of-May levels in history

Unless tropical depression Amanda does something miraculous, and quickly, Lake Mead will end May at its lowest level for this point in the year since Elwood Mead and his buddies filled the reservoir in the 1930s, 20 feet in surface elevation below last year at this time.

The “tropical storm Amanda” thing was a joke. It would take enough rain to raise Mead’s surface elevation 6 feet to avoid the ignominious record. That will not happen. We are headed into new territory this year in the management of the Lower Colorado River, or “LOCO,” as my new favorite acronym would have it. But it’s not fair to call this, as I did in the first draft of this post, “uncharted territory”. We have some pretty good charts to guide us through this territory. Let’s start here, with the latest estimates presented at this week’s USBR meeting of water managers (pdf):

Lake Mead projected elevations, 2014-15, USBR

Lake Mead projected elevations, 2014-15, USBR

Based on the current projections, I’ll be able to do this cheap journalistic IT’S THE LOWEST IT’S BEEN THIS MONTH SINCE THEY FILLED IT clickbait schtick pretty much any time I want at least through the end of the water year, Sept. 30.

Why is this happening?

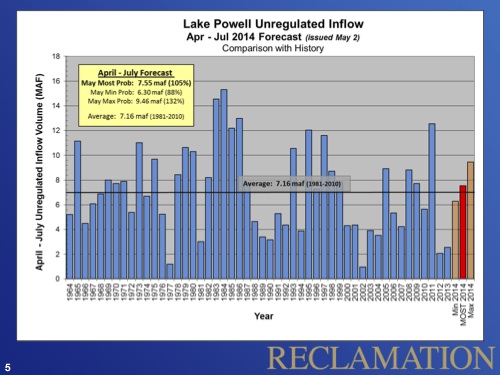
Annual inflow into Lake Powell, USBR

Annual inflow into Lake Powell, USBR

It is tempting to say “drought”, and that’s not wrong. 2014 is likely to end up as just the fifth year in the last 15 with above-average flows in the Upper Colorado River Basin, where most of the river’s water originates. This is a funky bar chart, but ignore the two brown bars, the red one is the most likely 2014 Lake Powell “unregulated inflow” – the amount of water that would flow into Lake Powell if there were no dams or water users upstream. So yes, the system as a whole has been dry.

That has resulted in a under-delivery this year of water from upstream into Lake Mead, but as I wrote last summer, the gap here is small, and more than made up for by a massive slug of bonus water delivered in 2011.

But equally important if not more important, the second reason Lake Mead is dropping is because they river’s managers release so much water each year for downstream users. The latest data (pdf) estimate this year’s inflow into Lake Mead at 8.2 million acre feet of water. Combined releases for downstream use in LA, San Diego and Imperial Valley, plus evaporation, plus the water pumped up the hill to Vegas, total 10.4 million acre feet.

The result of all that takes us into the charted territory I was talking about above. That little circle on the right of the first graph – note the dotted red line – shows a real possibility that Lake Mead could end 2015 with a surface elevation below 1,075 feet above sea level. At that point, the first ever shortage would be declared in the lower basin. We have a quite clear roadmap, laid out in the 2007 river management agreement among the basin states. Deliveries to Arizona and Nevada would be cut. (Brett Walton has done a great job of explaining the nitty gritty.)

If all goes well, this would be about the time my book comes out, which would be great for sales. I’ve got some perverse incentives as I watch this play out.

Pollution cleanup as a solution to water supply shortfalls

As Southern California looks at its next water supply steps, one of the top items on its agenda is cleaning up groundwater contamination. It’s cheaper than building more storage. So says MWD’s Jeff Kightlinger:

I think you’re going to see the next wave of investments over the next decades in Southern California focused around issues like recycled water and groundwater basin cleanup. We see that as better bang for the buck.

Our increasingly efficient use of water

Another reason for optimism about our ability to solve our water messes:

[I]n most regions, the water needed to feed one person decreased even if diets became richer, because of the increase in water use efficiency in food production during the past half-century.

Global Changes and Drivers of the Water Footprint of Food Consumption: A Historical Analysis; Chen Yang and Xuefeng Cui; Water 2014, 6(5), 1435-1452

Thanks to Linus Blomqvist for the pointer.