Stuff I Wrote Elsewhere: Tea at the Santa Fe Institute

I used to write a lot about the Santa Fe Institute and the fascinating trans-disciplinary research that goes on there, but in recent years I sorta lost touch. I went up last week for a visit to reconnect, and, among other things, have tea (sub/ad req):

SANTA FE — To understand the Santa Fe Institute, best to drop by around 3 in the afternoon for tea.

One recent afternoon around cakes and iced tea in the institute’s courtyard, the conversation drifted easily from linguistics to statistics to molecular biology to the history of geology to the history of astronomy in India to the big bang and the origin of the universe to quarks. In no particular order.

“It turns out,” paleontologist Doug Erwin said, “that if you get people together from very different disciplines and feed them, a lot of good things will happen.”

Pentagon Pull

Re Dan Sarewitz’s Nature column of last April about the value of “Pentagon pull”  to drive energy innovation, here’s Elisabeth Rosenthal in the New York Times:

Even as Congress has struggled unsuccessfully to pass an energy bill and many states have put renewable energy on hold because of the recession, the military this year has pushed rapidly forward. After a decade of waging wars in remote corners of the globe where fuel is not readily available, senior commanders have come to see overdependence on fossil fuel as a big liability, and renewable technologies — which have become more reliable and less expensive over the past few years — as providing a potential answer. These new types of renewable energy now account for only a small percentage of the power used by the armed forces, but military leaders plan to rapidly expand their use over the next decade.

Water Pricing in California

When the price of water rises, ag users feel the most pain.

That seems to be what is happening in northern San Diego County, where rising prices of water delivered by the Metropolitan Water District to the Valley Center Municipal Water District is apparently making a big dent in the avocado business, reports Pat Maio:

The district has found itself in the eye of a supply-and-demand hurricane. Water rates have soared 50 percent or more to agricultural customers in the last few years as the chief supplier, the Metropolitan Water Authority, has moved to end a subsidy program for farmers and jack up wholesale rates as supplies have become scarce.

Growers, meanwhile, complain that they can’t keep pace with the higher bills, so some are turning off meters as they abandon fields, either temporarily or permanently.

In the last month or so, meters have been turned off on hundreds of acres of avocado groves in the Hidden Meadows area north of Escondido and along Cole Grade Road in Valley Center, according to farm and water officials.

Other groves are being taken out of production as well. Overall, more than 5,000 acres have been taken out of production in the last year, according to Eric Larson, executive director of the San Diego County Farm Bureau.

(h/t Groksurf)

In Search of the Rio Grande

This being “World Rivers Day“, I spent the morning puzzling over the nature of ours.
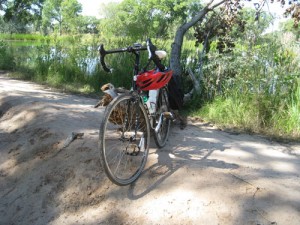
My New Bicycle

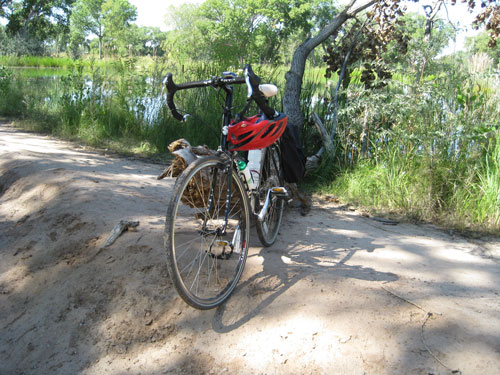
My New Bicycle, September 2010

Truth is, I was planning on being aware of our river this morning anyway, via a ride on my new bicycle (seen here propped against a log at one of the constructed wetlands adjacent to the Rio Grande). I don’t really need formal river awareness activities. I’m down by the Rio Grande most weekends, and quite a few weekdays, being aware. Our river is a source of endless fascination.

One of the new bike’s main purposes, in fact, is to get me down to the river. It’s a hybrid road-dirt machine, so I can ride the five miles of street I need to get to the river, then ride the levees and dirt trails. (Bike geek tech here.) I’ve kitted it out with saddle bags to hold binoculars for bird-watching and enough food and water to get lost in my thoughts without incurring significant danger.
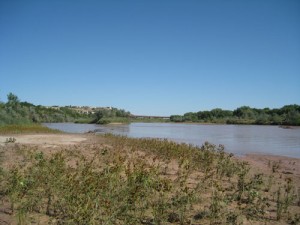
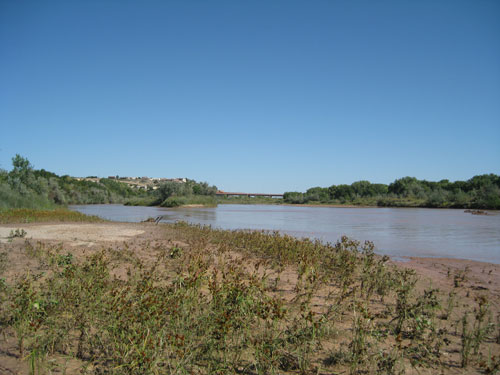
Rio Grande, September 2010

Rio Grande, September 2010

This morning I used it to get off the paved bits and onto the levee roads that flank the river through the heart of Albuquerque.

Albuquerque’s relationship with its river is an odd one. When I moved here 20 years ago, I was puzzled by the way the city turned its back on the Rio Grande. Aside from bridges carrying cars across it, there were very few places where you could actually get out to see the river. Few trails or picnic tables or benches. It has changed a bit, but not a lot. The Rio Grande is arguably the proximate cause of my city’s location in this particular spot of all other spots in which it might have been built. But it’s like it’s now been used and discarded.

This picture was taken on the west side of the river, looking north toward the big Interstate 40 bridge across the river. In the foreground, you can see a mud flat still wet from the high flows caused by an epic storm last Wednesday. A guy died. They found his body on an island upstream from here. But that’s another story.

For purposes of this narrative, you’d have to follow me up a levee road until it peters out on a stretch of river where the bluffs obviated the need for flood control protection, and there’s nothing but little single track through the willows, one of which dumped out on the mud flat. I guess enough people do care about their river to keep beating out the single track, because this is not a trail system, just people like me trying to figure out how to get out to see the Rio Grande.
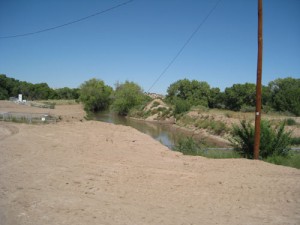
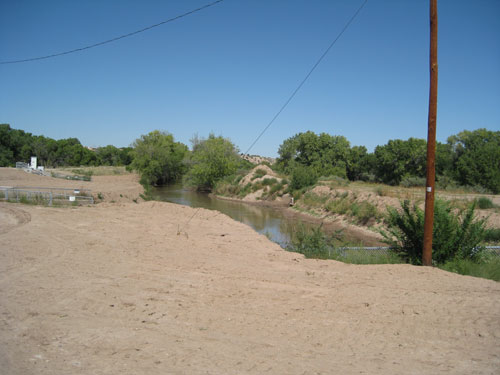
Rio Grande irrigation ditch

Rio Grande irrigation ditch, September 2010

The Rio’s flowing at about 600 cubic feet per second through Albuquerque as I write this, which means nothing if you’re not a water numbers nerd. Three points of comparison:

  • The flow in the Rio today is about 50 percent above normal for this time of year.
  • Wednesday night’s flood was four times higher, which was enough to kill a guy.
  • The Mississippi at St. Louis is flowing at 431,000 cubic feet per second right now.

I’m a numbers guy, so thinking about the Rio Grande, for me, involves thinking a lot about numbers like these – cubic feet per second, acre feet per year. But it’s also important for me to get out as often as I can and look at the river, to help make sense of the numbers.

I looped back south and then across the river, where I stopped to look at one of the main irrigation ditches. It serves as a reminder of why Albuquerque is where it is – water diverted from up north, being carried to farms south of here. It’s another way of thinking about the – not flood danger, or recreation, or nature, but food. The river here, in a sense, spreads out across the middle Rio Grande Valley in a vast distributary system of ditches that you could think of as being as much river as the main channel is through this stretch of New Mexico.

A few years back, I interviewed one of the ditch riders, who talked about how spring is his favorite time of year, when they first turn the water out into the ditches and the valley starts greening up. It’s like the valley is taking a great deep breath, he told me.

Lots of different ways to be with, and to think about, our river.
River Beat: End of the Water Year, Taking Stock

“Water year” 2010 ends next week, making this a good time to take stock of our historic position on the Colorado River. And by a couple of different measures, things are truly historic:

  • The latest forecast (and right now forecasting amounts to tiny fractions of in inch) puts Lake Mead’s surface elevation at 1084.14 feet above sea level at midnight Sept. 30, the official end of the water year. That is the lowest end of a water year since 1936, when Mead was being filled for the first time.
  • The latest weekly forecasts show Mead dropping below 1083 during the third week in October, which by another measure (lowest surface level at any point in the year) drops below the lowest point of the drought of the 1950s. That’s the point at which we can unambiguously say Mead is the lowest it’s been since they filled it in the 1930s.
  • Perhaps more importantly, the surface elevation level translates to an end-of-year storage level of 10.1 million acre feet of water, which is by far the lowest storage level at the end/start of a water year on record. This is the measure that matters the most, and by this measure we’ve been lower than the 1950s levels for a while. (Total storage for a given surface elevation decreases as the lake silts up.)
Lake Mead storage

Lake Mead Storage, data courtesy USBR

Click on the image for a bigger version, but it’s pretty easy to see at a glance what’s been happening. Since the late 1990s, the reservoir that supplies water to Las Vegas, LA, San Diego, Phoenix and the vast farm empire of Imperial County has been in decline.

The U.S. Bureau of Reclamation released the latest draft of its 2011 Annual Operation Plan last week, with a preliminary summary of the year just past. In short, it was dry:

Inflow to Lake Powell has been below average in nine of the past eleven water years (2000-2010). Although slightly above average inflows occurred in 2005 and 2008, drought conditions in the Colorado River Basin persist. Provisional calculations of the natural flow for the Colorado River at Lees Ferry, Arizona, show that the average natural flow since water year 2000 (2000-2010 inclusively) is 12.0 maf (14,800 mcm). This is the lowest eleven-year average in over 100 years of record keeping on the Colorado River.

Lake Powell, located upstream, is the collection point for most of the Colorado’s flow. Reduced inflow there means less water to be released for downstream users.

It is important to remember that, despite the drought conditions, releases from Lake Powell have been sufficient during each of those 11 dry years to meet the Upper Colorado Basin states’ legal obligations under the Colorado River Compact. Drought has eliminated the surpluses on which the lower basin had come to depend, in the process laying bare the real problem with Colorado River Management. (see my May post for an explanation of the problem.)

But numbers, schmumbers, right? Via NASA, some pictures that tell the story better than any of my pretty graphs:

Lake Mead Circa 1985

Lake Mead Circa 1985, courtesy NASA

Lake Mead Circa 2010

Lake Mead Circa 2010, courtesy NASA

(thanks to Tom Yulsman for pointing out the NASA images)

Stuff I Wrote Elsewhere: The Jevons Paradox

From this morning’s newspaper, a column (sub/ad req) about the reasons energy efficiency may not save as much as its advocates frequently claim:

In a new paper, a team led by Tsao has drawn international attention by arguing that, instead of leading to reduced energy consumption, super-efficient bulbs may instead lead to people simply using more light.

In some cases, in a result that seems counterintuitive, energy consumption could actually rise. But this is not a bad thing at all.

To understand why, take a trip to the villages in rural Costa Rica where Michael Fark has been working.

Fark heads a Canadian nonprofit called Lighting Up The World, which has been trying to get the super-efficient light bulbs developed by people like Tsao into the hands of the people who need them most.

There, one- or two-room clay brick houses are usually lit by candles or kerosene lamps.

It is lousy light by our standards, barely enough for the young Costa Ricans to do evening schoolwork after a day of helping in the fields. But that light, dim as it may be, is so precious that families spend up to 30 percent of their cash flow on candles or kerosene for a few hours of light per day, according to Fark.

Give the Costa Rican farm families a more efficient way to light their homes, as Fark’s organization is doing, and they will choose to consume more light, not less energy.

Multiply their predicament by some 2 billion people in poverty around the world, and you enter the counterintuitive world of “the Jevons paradox.”

The Politics of the Colorado River Compact

In a debate between candidates for Colorado Congressional District 3 (the western part of the state, including the west slope and Colorado river), the two candidates are reported to have shown clear agreement on an important point:

Both pledged heartily to fight all efforts to reopen the Colorado River Compact.

Also, all efforts to switch the United States to a monarchy with Lada Gaga as queen will similarly be opposed with the utmost utmostness.

La Niña and the Colorado

Colorado River Basin

Colorado River Basin, Courtesy Scripps Inst. of Oceanography

With La Niña rapidly strengthening, it is reasonable to ask what can be said about the resulting effect on flows in the Colorado River. The short answer: not much.

It is reasonable to guess otherwise, because so much of the southwest depends on the Colorado for its water supply, and because La Niña is so well known as a bringer of drought in the southwest. But the important fact here is that La Niña’s strongest effect is found in the southern part of the basin, while most of the Colorado River’s water comes from the northern part of the basin.

You can see from the map above that the Colorado River Basin stretches across mountainous western Colorado and into Wyoming. The vast majority of the Colorado’s flow falls in the area colored green on the map, which very little contribution from the desert rivers of the lower basin (the brown bits). For all practical purposes, the flow measured at Lee’s Ferry defines the available water on the Colorado system, which is why that was the point chosen for dividing the river’s water under the Colorado River Compact.

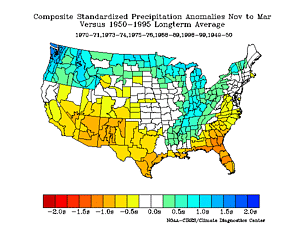
Precipitation Anomalies

Precipitation Anomalies, courtesy ESRL

As you can see from map number two, La Niña’s effect on precipitation is far greater to the south, and less to the north. This is Nov-March precip, which is the snowpack season and captures the key climatological period in terms of both water supply development and also La Niña’s effect. The color scheme represents standardized precipitation anomalies in standard deviations from the mean during La Niña years. The main message is that yellow is a little drier than average, browns are a lot drier, and Florida and southern Georgia are screwed. But that’s the subject of another blog post.

But we’re really interested here in water in the river, not rain and snow falling on the ground. The folks at the Colorado Basin River Forecast Center have an excellent, user-friendly collection of data. I look at their estimates of naturalized Lee’s Ferry flow (what it would have been if not for upstream dams and diversions). What it shows is that there is almost zero correlation whatsoever between the El Niñ0-La Niña condition (ENSO) and flow on the Colorado River. Here, for example, is April – July streamflow (the months when the vast majority of the water is coming off) compared to sea surface temperature in the ENSO 3.4 region, which is the key area for impacting our climate, from Nov-March. You can slice up the data a lot of different ways, but there’s just not much of an effect on average at Lee’s Ferry:

ENSO and Colorado River Flow

ENSO and Colorado River Flow, courtesy CBRFC

(A big thanks to Kevin Werner at the CBRFC for helpful discussion today about this issue.)

Hoover Dam, Servant of the People

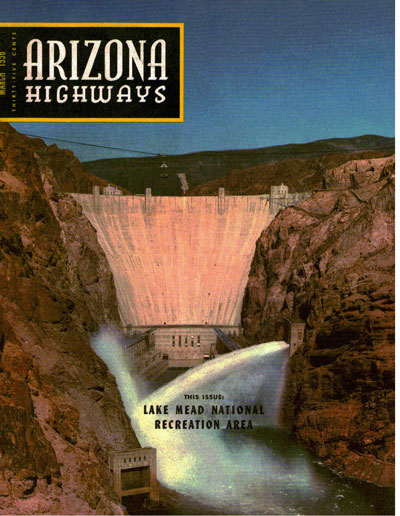
Lissa found a treasure for me at Sam Weller’s in Salt Lake City – the March 1956 issue of Arizona Highways:

Arizona Highways, Lake Mead, March 1956

Arizona Highways, Lake Mead, March 1956

Among the gems within is Ak Akvik’s Servant of the People (tribute to Hoover Dam). An excerpt:

Below,
stilled forever
the red rage of the angry river.

Below,
in blue serenity,
as docile as a week-old lamb,
the fever and boiling fury of the flood.

I helped win a war.
I bring light to a million homes.
I turn countless wheels in numberless factories.
Because of me, hundreds of thousands of acres
of useless land now grow green and nourishing crops.

I’m a shining and triumphant chapter in the epic of America.
I’m a servant of the people.

By a useful coincidence, the spring of 1956, during the heart of the drought of the 1950s, was the month at which Lake Mead hit what remains its historic low since it was filled in the ’30s. There’s no mention that I can find of drought in the Arizona Highways paeans to Mead’s recreational beneficence. But in some of the pictures of happy water skiers and fisherpeople, you can see a bathtub ring in the background.

The lake surface level ended the month of March 1956 at 1083.57 feet above sea level (historic monthly data here), which I’ve been calling the historic low. But the fine folks at the USBR in Boulder City recently fed my obsession with this historic milestone by pointing me to some more fine grained data, based on daily and in some cases hourly readings. The numbers show that Mead dropped further, down to 1083.19 by April 26, 1956, before beginning to rise again with the spring snowmelt.

As I write this (midday, Sept. 18, 2010), the lake level is at 1085.42, a bit over 2 feet above the historic low. The latest forecast numbers show Mead dropping past its April 1956 low some time during the third week of October.