Stuff I Wrote Elsewhere, Dead Tree Edition

That was a pun. It’s a story about dead trees (ad/sub req.). Printed on paper, which is made of dead trees.

The dead piñon trees stretching across northern New Mexico’s Pajarito Plateau stand out, stubborn clumps of gray still standing six years after they died.

They were not alone. Craig Allen, the scientist who chronicled their demise, ticked off a list of the things he watched die with them during the drought of 2002-03: juniper, blue gramma grass, ponderosa pine, Douglas fir, even cottonwoods.

Warming temperatures played a role here, and new evidence suggests the same thing may be happening around the world.

An international scientific team headed by Allen reports that similar forest dieback might be on the rise globally.

More on the paper from USGS.

Climate Change and Southwestern Drought

If we can all avert our eyes for a moment from the CRU emails, the inexorable momentum of climate science hurtles down the track with a new paper in today’s Science using paleo records to suggest (among many interesting things) that a warming world is, for the southwestern US, a drier world.

Mike Mann and colleagues (yeah, I know, get your mind off the emails, dammit!) have used a network of proxies in an attempt to reconstruct spatial variability for the Medieval Warm Period and Little Ice Age. For those of us in the Southwest, the reconstruction of sea surface temperatures in the equatorial Pacific is of particular import. The paper supports an argument Mann and others have previously made that the MWP was characterized by persistent La Nina-like conditions, a cooling along the equator that, among other things, leads to generally drier conditions here in the Southwest.

Mann and others (see Volcanic and Solar Forcing of the Tropical Pacific over the Past 1000 Years, Journal of Climate, Vol. 18, 447-456) have argued in the past for a sort of “thermostat” mechanism, where generally warm conditions create a cool anomaly in the Pacific, a “thermostat effect”. From the new paper:

The paleoclimate reconstructions presented here hold important implications for future climate change. For example, if the tropical Pacific thermostat response suggested by our analyses of past changes applies to anthropogenic climate change, this holds profound implications for regional climate change effects such as future drought patterns.

Forecasting the Colorado

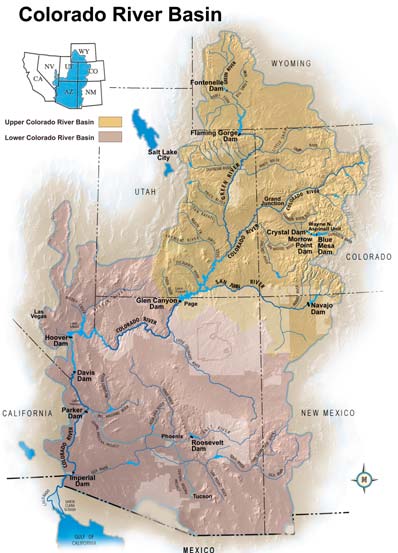
It’s early days yet in terms of a forecast for 2009-10 flow on the Colorado River. Because it depends on the amount of snow that falls on the Colorado Basin’s mountains, there is great uncertainty this early in the year. But the map below can give us some hint about the probabilities:

Drought Monitor

Drought Monitor

What you can see is the expanding area of abnormally dry conditions across southwest Colorado. A few good snowstorms can wipe out a precipitation deficit quickly in conditions like that. But antecedent soil moisture conditions do matter, because dry ground soaks up moisture that would otherwise run off into the river. The Nov. 1 soil moisture map from the Colorado River Basin Forecast Center (it’s a big jpeg, you can see it here) showed soil moisture deficits throughout the basin. The most recent median forecast for flow into Lake Powell is 83 percent of the long term average.

Weart on CRUgate

I’m on vacation this week, with family converging, new binoculars in hand and birds to count, so posting will be light or (I hope) nonexistent other than my continued attempts to sell the book. But the whole climategate fiasco is one of those horrific-looking wrecks that you can’t avoid looking at and wondering if anyone was really hurt. In that regard, Andrew Freedman shares a great conversation with the wise science historian Spencer Weart:

I don’t expect this to have much impact on public perceptions of climate and climate scientists. Opinions have become so fixed that it would take serious evidence to shift a significant number of people. Since the late 1980s, just about every year and sometimes almost every month, a group of people (mostly the same ones) have exclaimed, “Now in these latest (whatever) we finally have proof that there is no need to worry about climate change!” There is a segment of the public that has believed every new claim. The rest will continue to doubt such claims in the absence of truly solid proof.

In other words, nothing to see here, move along.

John Wesley Powell

When I was a little kid, I thought John Wesley Powell was the coolest, the one-armed adventurer daring the unknown as he ran the rapids of the Grand Canyon – the “Great Unknown” – for the first time. Standing on the Grand Canyon’s south rim, I would stare down at those little glimpses you get of a bend in the river and imagine Powell and his mates floating by.

Powells boats on the Colorado

Powell's boats on the Colorado

It was much later that I realized how insanely cool really he was in a more “grownup” sense, first when I read Wallace Stegner’s Beyond the Hundredth Meridian: John Wesley Powell and the Second Opening of the West and then when I started reading Powell himself. He was far more than a brave adventurer in the 19th century mold. He was also the first person to try to bring science to to the questions of how (and how not) to build a society in a place like this. So when I began talking with the University of New Mexico Press several years ago about doing a book for young people on climate, water and the West, choosing Powell as a central character was a no-brainer.

As I write in the book’s introduction:

The science of tree rings hadn’t been invented when explorer John Wesley Powell made his epic trips down the Colorado River in the 1800s. But he noticed the way the river rose and fell. Eventually, he realized how important that was for people trying to live in the West.

The book is aimed at kids around 13 years of age. I’ll have more posts over the next few weeks introducing some of the other characters, both from history and those working now using tree rings and weather forecasts to make sense of weather and climate. Human-caused climate change plays a role, but it’s not a book about climate change. Rather, it’s an attempt to help young people make sense of the weather and climate they see around them every day, and to share some of the excitement I’ve been lucky enough to enjoy talking to the scientists who work with this stuff every day.

Shipping now on Amazon: The Tree Rings’ Tale: Understanding Our Changing Climate (Worlds of Wonder)

Will Mead Get an Extra Shot Of Water in 2010?

Given the sturm und drang over Lake Mead’s dropping levels and their implications for the water future of Las Vegas, the preliminary numbers in the U.S. Bureau of Reclamation’s 2010 Annual Operating Plan are worthy of note.

The latest posted version of the plan is marked “final draft”, but I’m told it’s essentially complete, and won’t change in any significant way.

The bottom line: there is a good chance (essentially 50-50, according to the U.S. Bureau of Reclamation) that inflows to Lake Powell, the major upstream reservoir on the Colorado, will be sufficient to permit extra water, above and beyond Colorado River Compact levels, to be released through the Grand Canyon and into Lake Mead.

The details are arcane. Click through if you want to muddle along with my explanation.

Continue reading ‘Will Mead Get an Extra Shot Of Water in 2010?’ »

Atlanta’s Remarkable Water Conversation

It’s worth noting that the current conversation about Atlanta’s water future has not arisen because of questions about sustainability of water supplies for the various users in Apalachicola-Chattahoochee-Flint River Basin. It’s instead the result of a legal issue: Atlanta’s primary source of supply, Lake Lanier, was never authorized by Congress to serve as a water supply dam.

Lake Lanier

Lake Lanier

There may be legitimate questions about adequacy of supply down there, but that’s not what this fight is about. Still, as the Atlanta Journal-Constitution reports, it’s a hell of a fight, the highest stakes water war in the country right now. If no deal can be worked out, Atlanta loses its source of water in 2012:

The U.S. Army Corps of Engineers is preparing to tighten the spigot at the Atlanta region’s main source of drinking water based on a federal judge’s stinging ruling in the tri-state water dispute.

Corps officials say they will rewrite their operating manuals for the Apalachicola-Chattahoochee-Flint River Basin to prohibit certain water withdrawals and releases from Lake Lanier after July 2012. Only Buford and Gainesville would be allowed to continue pulling drinking water from the lake under the Corps’ plans.

(Image of Lake Lanier in happier days, courtesy U.S. Army Corps of Engineers)

Could Global Warming Be Good for Colorado River Flows?

Pasadena, CA, blogger Wayne Lusvardi, who sometimes writes about that city’s water problems, had a post recently suggesting that global warming might lead to increased flows in the Colorado River.

This would, of course, be excellent news for Pasadena and others who use Colorado River water (thought it does conflict with some of the literature – see for example here, here, here, here, here, here, here, here, here, here, here, here and here). So it’s worth looking at how Wayne arrived at his conclusion.

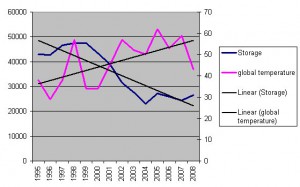
As it happens, he’s using some data I assembled recently from the U.S. Bureau of Reclamation on storage in Lake Powell and Lake Mead, the two big main stem reservoirs on the Colorado River. Comparing my graph to a graph of global temperatures since 1995, Wayne said… Well, I’ll let him explain:

There appears to be a rough correlation between global warming and more water storage along the Colorado River.

Wayne did this by eyeballing my graph and a 1995-present global temperature graph. I’m not sure where he got the temperature data, but since I’ve got the data for the first graph, and NASA’s GISS data is easily available, I took the step of overlaying global temperature and Colorado River storage on the same graph, just to make the eyeballing easier. As a bonus, I added linear trend lines to make it easier to see the painfully obvious.

The temperature data is the anomaly from the 1951-80 base period. The storage number is total acre feet of water in Lakes Mead and Powell combined. Now, I would not begin to argue this is a reasonable way of evaluating the question. Total storage depends on both annual inflow as well as consumptive use in the seven basin states. In addition, each year’s storage data is significantly dependent on the amount of storage in the system the previous year.
Wayne's World

But let’s just take Wayne’s methodology on its face and see if there’s anything to the argument he is making anyway. Hmmm. Looks like the data seem to be doing rather the opposite of what Wayne seems to be suggesting. As temperature rose, storage went down. A little mathemagic shows, in fact, that the correlation is negative. This should be obvious. Temperature has been going up. Colorado River storage has been going down. It’s in no way statistically significant, but if you want to make the argument Wayne offers up, it’s worth noting that such an argument comes to the opposite conclusion. Gotta follow the data where they lead, Wayne!

But perhaps I’m not being fair. As Wayne said, “The charts … are only suggestive and should not be construed as valid science.” Thank goodness for that.

Poem of Protest

This picture of student protests at UCLA, which came across the twitter today, reminded me of one of my all time favorite bits of graffiti:

It must have been 1975 or ’76, and I was at UCLA with my dad to see art. In the parking garage elevator was this poem, written in black felt pen:

smoke dope

fuck in the streets

smash anything

that looks elite