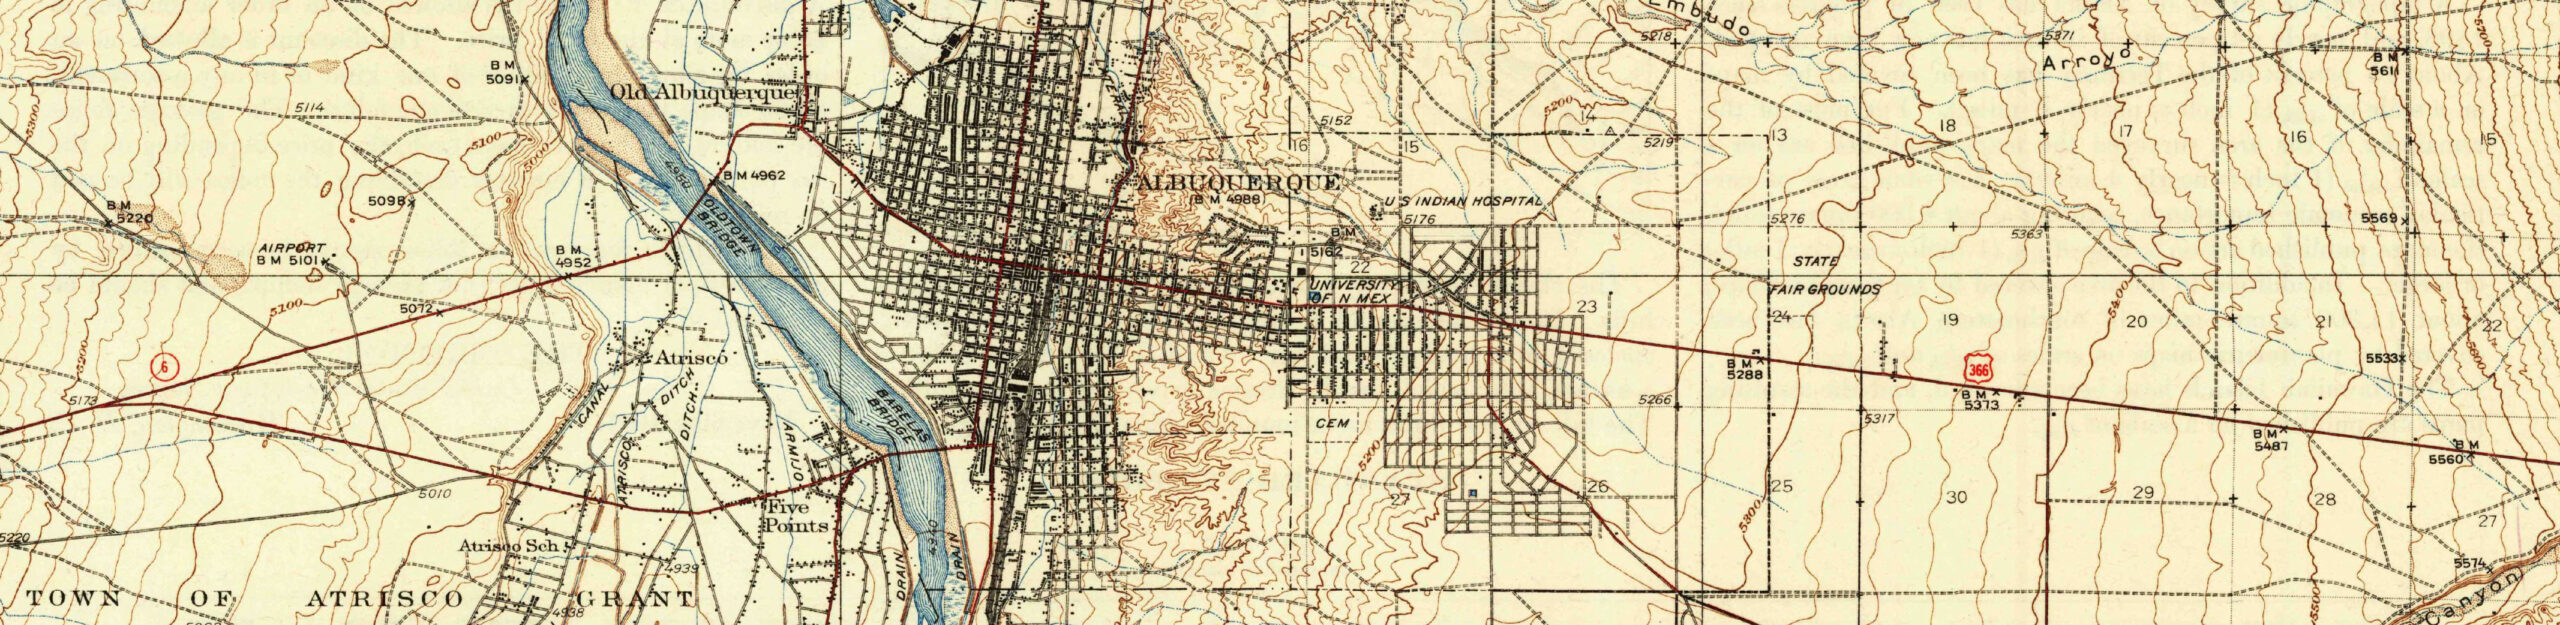
Dave: Take Shorter Showers
North Carolina Gov. Mike Easley has asked my friend Dave to take shorter showers:
The Governor of North Carolina, Mike Easley, announced on Tuesday he is calling on citizens across North Carolina to cut water consumption by 50 percent between now and Halloween. I guess you could think of this as a big science fair project, but on a state level.
Climate Change and California Fires
Aquafornia has a great compilation of reporting on the question of a climate change link with respect to the California fires. The bottom line? Yes! No! Maybe!
The most compelling research to me on this question is Westerling et al. in Science last year. Aquafornia quotes an LA Times piece with a nice summary of the result:
The study, however, found Southern California was different from the rest of the West, with no increase in the frequency of fire as temperatures rose. “In Southern California, it’s hot and dry much of the year,” said Anthony Westerling, a climate scientist at UC Merced and the study’s lead author. In other words, Southern California was already perfect for fire.
Revkin
Stuff I Wrote Elsewhere
Atlanta drought in a New Mexico newspaper:
The problems New Mexicans face are different than those of Atlanta. We use groundwater for most of our cities’ drinking water, an option Atlanta does not have. In addition, the arid climate of the West is much more variable than in the South. In response, we have built large, multi-year reservoirs that buffer water users against one or a few dry years.
But our underlying long-term problems are similar. Our growing population and resulting increasing water demand also leave us vulnerable to natural dry spells. And in the West, the tree ring record shows those dry spells can be severe and very long lasting.
Stuff I Wrote Elsewhere
On climate change’s impact on New Mexico:
Diminishing water supplies as a result of global warming could cost New Mexico’s economy hundreds of millions of dollars a year over the next century, according to a new study.
The study, to be unveiled at a news conference this morning in Albuquerque, found that an already arid New Mexico is “highly vulnerable” to climate change.
The average flow in the Rio Grande could drop by one-fourth over the next 75 years in response to climate change. With water supplies already stretched to the limit and the population growing, the state’s economy, especially agriculture and recreation, could suffer, the study’s authors found.
Riverside ecosystems are also likely to suffer.
More Georgia Drought

I spent some time yesterday looking for better measures than simple precipitation to describe the current drought situation in Northern Georgia. This is from a data set of Palmer Hydrologic Drought Index for north-central Georgia from the National Climatic Data Center. One of the problems with using precipitation alone, which I’ve been blogging about thus far, is that it doesn’t take temperature into consideration. The last year has been warmer than the long term average in northern Georgia, which can exacerbate drought conditions. The Palmer formula takes that into account. The Palmer hydrologic index is a variant of the classic Palmer index that takes into account longer term precipitation deficits, which seems to match most closely what we’re talking about in northern Georgia.
With that as a preface: Current PHDI for north-central Georgia is -4.59, which definitely qualifies as a badass drought. But if you look at the graph, you’ll see that Georgia has had lots of droughts this bad over the last century – seven that are at -4 or worse, which is the neighborhood we’re in right now.
Questions About the Georgia Drought
A list of questions I have about the Atlanta running-out-of-water situation. I pose them here, lazy-blog style, hoping someone out there knows the answer:
- to what extent does the Atlanta water supply have multi-year storage capabilities – to store extra during wet years for use during dry years
- what’s the relevant time scale for understanding drought in northern Georgia – one year? two years? five? ten? (this may simply be a different way of stating the above question about multi-year storage)
- what effect did the sustained dry periods of 1999-2002 or the extremely dry years of the 1980s have on water supply
- to what extent is groundwater used in northern Georgia
- what’s the breakdown of consumptive water use in northern Georgia between agriculture (is there any?) and municipal and industrial use
More Georgia Drought Numbers
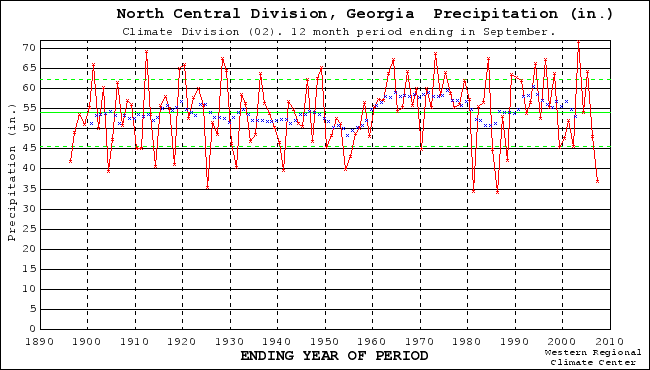 Reader Tim rightly points out that my Georgia rainfall graph is the state as a whole, while the drought is primarily confined to the northern part of the state. Here’s the north-central Georgia climate division. (The northwest and northeast graphs look quite similar.) I think the point is similar. Depending on what time scales you’re looking at, you can again see repeated similar dry spells across the 20th century, especially during the 1980s. Tim said the Atlanta papers have been saying soil moisture is at a 100-year low. Given the general poor quality of soil moisture time series in this country, you can color me skeptical on that claim. But the University of Washington VIC group, my standard source for soil moisture, has a bullseye of 100-year low sort of soil moistures in the Carolinas, but most of northern Georgia looks from the VIC map to have more like a 5th to 10th percentile sort of soil moisture condition.
As for Atlanta itself, it’s received a bit more than 34 inches at the airport in the “water year” (Oct. 1 to Sept. 30). The airport’s records go back to 1930. This is the seventh year since 1930 that it has been in the 35 inches or less range. In other words, the actual Atlanta rainfall, if it is a useful gauge, is about a once every ten year phenomenon. In terms of two-year accumulations, the return interval is similar.
By that data, northern Georgia is clearly living on the dry edge right now of the normal range of variability.
Don’t get me wrong here. I’m not arguing this is not a serious situation. It is clearly extraordinarily dry there. But it should not be viewed as some amazingly surprising and unexpected event. The past record shows that dry periods similar to the one Atlanta is now experiencing have repeatedly occurred in the instrumental record. Another comment worth pulling out from the same thread, this by Dano:
RP Sr said the same in a paper about the Colorado drought that peaked in 2002 – CO society is less resilient than in the past. GA society is also less resilient than in the past, not more. You’d expect that an advanced society would become more resilient over time. Instead, we are moving backwards.
Georgia’s Problems In Perspective
 We’ve got a full-on water war brewing down in Georgia right now, pitting states against one another (Georgia v. Florida), state against the federal government (Georgia v. Army Corps of Engineers) and endangered species against growing cities (Atlanta et al. v. mussels and sturgeon).
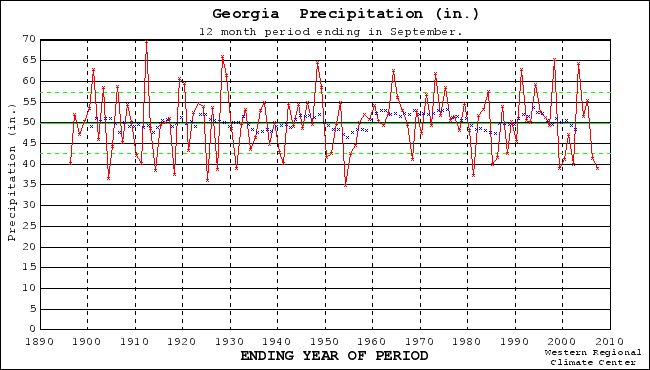
It’s worth stepping back a moment and considering the underlying definition of drought. For practical purposes, all it really means is less water than you’ve become accustomed to, or come to depend on to meet your needs. 39 inches (100 cm) of rain in a year would create disastrous flooding where I live, but in Georgia (that’s the statewide average over the year ending Sept. 30) it’s a disastrous drought.
But the graph I’ve included above suggests that there may be more to the story. Look at the period from 1990 to 2000. You can see that they had just one seriously dry year. The rest of the time saw either average or above average rainfall. And what happened between 1990 and 2000? According to the U.S. Census Bureau, the Atlanta metro area population grew 38 percent.
If you look back over the long term record (the graph above is from the Western Regional Climate Center), you’ll see that on a number of relevant time scales – one year, two, five, ten – Georgia has regularly seen “droughts” of this scale.
If you can’t handle events within the normal range of variability, you’re screwed.
Further reading:
- Parched Georgia threatens to sue Corps (good summary from the AP of the current situation)
- 1990 – 2000 Census comparison of U.S. Metropolitan Statistical Areas
- Watercrunch – great blog for following the current situation