A John Fleck Colorado River Discography

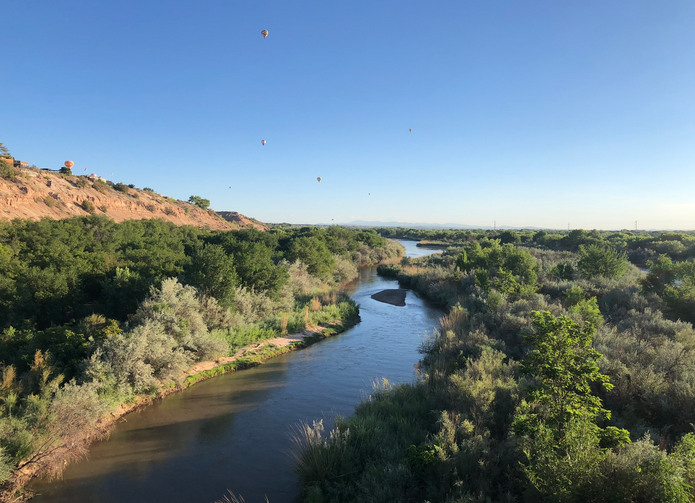
Fleck, Morelos Dam, 2014.

Doing the usual just-in-time tweaking of the fall class (like my old artist friend from L.A. who made a living scraping and painting freighters while they shipped up and down the West Coast), I’m updating the course’s Colorado River module.

I’d never actually pulled together a bibliography of my own stuff. Books, academic literature, significant grey literature, and one significant newspaper piece. Some of it’s Wonky and Important, some Breezy and Readable, a couple of things that I’m extraordinarily proud of (the books) I think managed to be both.

It’d cruel to make ’em read it all, some of this is pretty dense. But there’s some good stuff in here!


2016


Fleck, John. Water is for fighting over: And other myths about water in the west. Island Press, 2016.

Fleck, J. (2016). High tech desert: the great decoupling of the west’s water. The Breakthrough Journal, Summer 2016, 6.


2019


Kuhn, Eric, and John Fleck. “The Upper Basin, Lower Basin, and Mexico: Coexisting on the Post-2026 Colorado River.” Science Be Dammed Working Paper Series 2 (2019).

Fleck, John, et al. “The Evolution of Our Understanding of the Natural Flow of the Colorado River at Lee’s Ferry and its Importance to Critical Development Decisions.Science Be Dammed Working Paper Series 2019-01 (2019).

Castle, Anne, and John Fleck. “The risk of curtailment under the Colorado River compact.Available at SSRN 3483654 (2019).

Kuhn, Eric, and John Fleck. Science be dammed: How ignoring inconvenient science drained the Colorado River. University of Arizona Press, 2019.


2020


Jones, Benjamin A., and John Fleck. “Shrinking lakes, air pollution, and human health: Evidence from California’s Salton Sea.Science of the Total Environment 712 (2020): 136490.

Fleck, John, and Brad Udall. “Managing Colorado river risk.” Science 372.6545 (2021): 885-885.

2021

Fleck, John, and Anne Castle. “Green light for adaptive policies on the Colorado River.Water 14.1 (2021): 2.


2022


Kuhn, Eric, and John Fleck. ““The Consequences of the Compact Remains with Us”: Challenges and Opportunities for the Colorado River Upper Basin.” Available at SSRN 4094375 (2022).


2023


Fleck, John, and Eric Kuhn. “An Historical Perspective on the Accounting for Evaporation and System Losses in the Lower Colorado River Basin.Science Be Dammed Working Paper 4 (2023).


Fleck, John. “California Wants to Keep (Most of) the Colorado River for Itself.” New York Times, Feb. 23, 2023.

Deadpool Diaries: rekindling optimism?

Lake Mead used to be here. October 2022. Photo by John Fleck

Something remarkable is happening this year in the Lower Colorado River Basin that provides both a glimmer of hope about what durable basin solutions might look like, and also a clear demonstration of the obstacles still standing in their way.

Nevada’s Colorado River water use is on track to be the lowest it’s been since 1992

Southern Nevada’s projected 2023 use right now (the following is based on Reclamation’s Aug. 14 water forecast run) has dropped below 200,000 acre feet, sitting today at 199,943 af. That would be Nevada’s lowest take on the Colorado river since 1992. Southern Nevada’s population (Clark County, basically “greater Las Vegas”) has nearly tripled in that time.

Nevada has demonstrated its ability to take deep cuts without jeopardizing the structure and function of the communities that depend on Colorado River water.

Arizona’s Colorado River water use is on track to be the lowest it’s been since 1992

Arizona’s projected 2023 use, 1,974,819 acre feet, has dropped below 2 million acre feet, also the lowest since 1992. The Central Arizona Project, which supplies the Phoenix-Tucson area, is projected to take just 605,171 acre feet this year. That is 40 percent of CAP’s 21st-century average.

Arizona has demonstrated its ability to take deep cuts without jeopardizing the structure and function of the communities that depend on Colorado River water.

California’s Colorado River water use is on track to be the lowest it’s been since 2019

California’s use has dropped below 4 million acre feet, which would be the first time that’s happened since 2019, currently 10 percent below the state’s 21st century average.

Ok, the comparison is striking, right? Some states are doing a lot, other states are doing less. But I’m trying to be optimistic here, California’s water use reductions aren’t nothing! Everyone’s using less water!

But the relative depth of California’s cuts has not yet demonstrated its ability to take deep cuts without jeopardizing the structure and function of the communities that depend on Colorado River water.

The numbers

State Base allocation 2023 2023 reduction percent cut from base 07/DCP Cut beyond 07/DCP
California 4,400,000 3,997,677 402,323 9.1% 0 9.1%
Arizona 2,800,000 1,974,819 825,181 29.5% 592,000 8.3%
Nevada 300,000 199,943 100,057 33.4% 17,000 27.7%
Total 7,500,000 6,172,439 1,327,561 17.7% 609,000 9.6%


The Obstacles

The premise of a piece I wrote earlier this year in the New York Times is that there’s no way we can fix the Colorado River supply/use imbalance if California insists that the burden of overallocation and climate change fall on everyone else.

The new Schmidt/Yackulic/Kuhn paper puts the needed cuts at 20 percent just to stabilize the system – more if we’re going to rebuild a buffer against a repeat of last year’s shit show. Arizona and Nevada have figured out how to cut a lot more than that.

California, not so much.

A clarifying note on the picture

The above picture, which I took in October, no longer represents reality. Based on the latest Sentinel satellite imagery, a bit of water has returned to Boulder Harbor on Lake Mead’s western shore.


Weirdness on the edge of town

Two trees and an old mattress on a sandy wasteland with mountains in the background.

Weirdness on the edge of town.

Where no one asks any questions
Or looks too long in your face
In the darkness on the edge of town.

– Bruce Springsteen

Do you believe in ghosts? Or crows? Do you at least believe in crows?

Three of them. Possibly four. Crows, or possibly ravens. But I’d rather they be crows, so let’s call them that, because then they can be a murder of crows. Poe’s raven was alone, “Nevermore.” So crows it is. Their squawking, but in sentences, trying to tell me a story I couldn’t understand, gave me shivers.

I was alone on a bike, in a place too sandy for a quick escape, riding the hard packed bits, walking the sand, when I came upon the crows, beyond the pile of old mattresses and sofas and undifferentiated junk of a place lived in rough and cleared out fast. Because of my old arthritic feet, I try not to do too much walk-a-bike on the sand, but the crows urged me on. I didn’t trust them, but I went.

I was riding Albuquerque’s Central Avenue, Route 66, up Nine Mile Hill, past the edge of strip malls and subdivisions and safety, where the weirdness begins. Out dirt roads here are ragged houses with the kind of ratty “No Trespassing” signs you take seriously.

During the pandemic, this bit of the sandhills was home to a cluster of old RVs and camper vans, and I rode out there a lot in those dark months but never had the nerve to turn in. I’ll ride almost anywhere. “I’m so sorry,” I say, my excuse at the ready, gesturing at the computer on my handlebars, “the GPS said this was a road.” But I never had the nerve to turn in here. The place had a “For Rent” sign tacked on a makeshift gate back then, a light pole that looked like it might actually have electricity, and a mobile home that looked sorta permanent.

That’s all gone, all but the trees, which are a weird sight on the sandhills. How could there be trees here? Do you believe in ghosts? Or crows? Do you at least believe in crows?

When the crows had lured me in close, I saw a makeshift shelter hunkered low, so you couldn’t see it from the highway, tarpaper and scrap wood. And another. And another, at least three before I turned and beat it.

That’s when I noticed them, on the way out. Fresh tire tracks, since last week’s rain.


On the shortcomings of the way we measure water “use”

When I first got serious many years ago about the project of writing (in the newspaper at the time) about New Mexico water, I went looking for the numbers. How much do we have? Who uses what?

It’s a task that became central to my work. Eric Kuhn and I spent three years writing an entire book about the importance of having good numbers and using them to make good decisions.

As I prepare for another fall semester with first year water resources grad students, the question is fresh upon my mind. We spend a lot of time helping students up the bottom slopes of the “water numbers” mountain.

It’s doubly fresh because I’m in the midst of working up, with my Utton Center colleague Kate Tara, input in response to the U.S. Department of Interior’s request for comment on the agency’s post-2026 Colorado River management guidelines. A call for good data, used well, is key to our comments.

In preparing our comments, I had occasion this morning to re-read a really useful paper published earlier this year by Amy McCoy and colleagues about Colorado River data. The paper’s focus is a deep dive into the Bureau of Reclamation’s Lower Colorado River Decree Accounting reports, which to a water data nerd like me, writing about the Colorado River, have long served as a mineable lode of water policy ore. Which they are. But McCoy et al make a crucial point that I tend to forget: In my search for answers to the questions of “how much do we have” and “who uses what”, we can miss things that are incredibly important, but that fall through the cracks of this kind of an epistemology:

Water accounting in river systems endeavor to monitor and track diversions, deliveries, inefficiencies, and savings. Theoretically, water accounting creates transparency for the public, and can be a tool to improve river and water management, particularly as demands grow and supplies are nearly or fully allocated. However, accounting also reflects the historic cultural conditions that were in place when water laws, policies, and infrastructure were initially developed in the modern era. Rivers are complex systems, and accounting often takes a focused lens on elements that directly relate to the economy, such as consumptive use for agriculture and cities. This focus excludes complex elements that are difficult to track, that are not a direct part of the economic system, that are nonconsumptive uses, or that do not have legal allocations or entitlements. In the Colorado River system, elements outside of the historically constructed legal and accounting systems have included environmental uses, tribal water, and in many cases, groundwater. Because these water uses have not been accounted for, any degradation or changes can more easily go unnoticed.

This epistemology biases us toward ignoring important things.

The paper is McCoy, Amy L., et al. “A Survey of the Bureau of Reclamation’s Decree Accounting Reports in the Lower Colorado River Basin.” Journal of Water Resources Planning and Management 149.3 (2023): 04022085. (I think it’s here and not paywalled, though I sometimes can’t tell because I’m writing this on a computer on the university network.)

Breaking Albuquerque’s flash drought: Biggest monsoon storm in a decade

Map of Albuquerque showing Aug. 8, 2023 preciptiation, with amounts ranging from less than a tenth of an inch on the west side to 2 inches in the eastern foothills.

Breaking a flash drought: Aug. 8, 2023 rainfall in Albuquerque, Courtesy CoCoRaHS

August 8 is more than a little late for Albuquerque’s first solid monsoon rains to break our weirdly hot flash drought, but we’ll take it.

Typical monsoon onset here is early July, plus or minus a week-ish. At the risk of overstating because of a lack of precision, Aug. 8 is record late.

I was on a Zoom yesterday with a group of Colorado River colleagues when my phone started pinging insistently with the family’s traditional “rain here!” and “thunder!” from the various Fleck and Co. outposts scattered around Albuquerque’s city center. The rainfall numbers from CoCoRaHS volunteers, shown above, show a classic monsoon storm variability, but you can see the numbers growing as the cell(s) rolled up toward the foothills on the eastern side of the map.

Biggest Monsoon Storm by Fleck’s favorite measure in a decade

One good measure of the scale of these storms with respect to the city is Albuquerque’s North Diversion Channel, which collects runoff from the city’s built-up Northeast Heights, where most of us live. The channel integrates across a much more meaningful area than any single rain gage – the area where a bunch of us (including me!) live. The NDC peaked yesterday afternoon a bit after 3 p.m., just after my Zoom ended, at 7,630 cubic feet per second. That’s not a meaningful number for lots of you, so by point of comparison it’s our biggest NDC flow (and therefore the biggest single monsoon storm across this part of the city) since July 2013. (USGS data sources: NDC gage)

Ribbons of Green

For the new book, we’re writing a series of vignettes that track the Rio Grande over the course of a single year. For convenience sake, we’ve chosen this one (duh), so this stuff’ll go into the book. One of the tricks I’m using – this may not go into the book, it’s one of those “Danger, Fleck Doing Math!” things – is to monitor gages at the north end of the Albuquerque reach and the south end, a crude mass balance metric of how much water is being consumed in our stretch of the middle valley. This morning’s additions to my spreadsheet showed the reach adding water for the first time since I started keeping track. Usually we subtract water – which is to say, evaporation in this stretch of the river is what keep’s the valley green.

All of the storm’s water dumps into the Rio Grande in a hurry, through a network of concrete diversions channels mostly built in the 1970s as the city spread up onto the mesa on the river’s east side. It’s a sharp peak at the NDC outfall, but by the time the pulse reached the Central Avenue Bridge ~8 p.m. (five hours’ travel time) it was down to ~2,500 cfs. The volume of water probably shrank as some of it spread out into the bosque, but mostly it just spreads out in time, a sort of sloshing effect.


Albuquerque shutting down its river diversions because of low Rio Grande flows, going to groundwater

Stream entering a muddy river channel.

July 22, 2022, when wastewater from Albuquerque’s sewage treatment plant was the only thing keeping the Rio Grande here wet

Area water managers were informed this morning that the Albuquerque Bernalillo County Water Utility Authority will shut down its diversion of water from the Rio Grande for use in the municipal drinking water system, switching over to groundwater pumping to meet municipal needs.

The reason is low flows in the river. Albuquerque is constrained by a 2004 “biological opinion” from the U.S. Fish and Wildlife Service, which requires the municipal utility to shut down to minimize impact on the endangered Rio Grande Silvery Minnow.

The water Albuquerque diverts – when we’re diverting – is half water from our San Juan-Chama Project transbasin diversion (Colorado River water!) and half native water. We then kinda sorta return the native water to the river via the wastewater treatment plant. The idea is that half of it we consumptively use by dumping the Colorado River water on our lawns and trees, while the native water we run down the sink, clean up, and return to the river – an accounting exercise intended to leave the river whole.

The creates a weird bonus in the short run for the river when this happens, because now we pump groundwater to meet all those needs, and then dump some of that into the Rio Grande, thereby increasing the river’s flows in the short run.

Last summer, for a brief period of time, that pumped groundwater/wastewater was the only thing keeping the Rio Grand wet through the southern end of the Albuquerque reach,.

Rio Grande through Albuquerque could dry again this year

River flanked by woods with desert bluff to the left and tiny hot air balloons dotting the sky

Rio Grande in Albuquerque, Aug. 4, 2023. Photo by John Fleck

The Rio Grande, already dry in the San Acacia reach south of Socorro, has begun drying in the Isleta reach south of Albuquerque. And with a record hot dry summer, we could see it dry in Albuquerque again this year, as it did last year for the first time in 40 years.

Via Dani Prokop:

New Mexico’s largest river could dry again through the state’s largest city, for the second time in about forty years, if the monsoons continue to be weak.

“We could see drying in Albuquerque as early as mid-August,” (the USBR’s Carolyn Donnelly) said.

Problem 1 this year is that it’s hot and dry. Problem 2 is that El Vado Reservoir, built in the 1930s to store spring runoff for use at times like this, is under repair. So the stored water that would provide both irrigation and environmental benefits is unavailable.

This morning’s water management notes from the USBR noted 30 miles dry in the San Acacia Reach and a mile of dry riverbed in the Isleta reach.

Flow this morning through Albuquerque was a bit above 300 cubic feet per second. The median for this point in August is ~600 cfs.


Ribbons of Green: what we mean by “water policy”

aerial view of a bridge across a river

The interstate bridge being built across the Rio Grande, Albuquerque New Mexico, 1969, photo by Walter McDonald, courtesy Albuquerque Museum

Breaking out of my old “water policy writer” habits is hard.

The bridges of Albuquerque are helping.

Counting and Measuring

Prepping for an appearance on this Friday’s New Mexico In Focus on NMPBS, I’ve spent a bunch of time the last few days digging through agricultural water use data. (Spoiler alert: Ag water use has been declining in New Mexico for decades. Climate change adaptation is happening. When people have less water, they use less water.)

That’s long been a staple of my water policy writing – USDA NASS, and Cropscape, my beloved USGS Water Use in the United States data series, and on and on and on. You can’t manage what you don’t measure, amiright?

But our new book Ribbons of Green: The Rio Grande and the Making of a Modern American City, has me staring down the limitations of approaches I’ve used for so long.

Bridges

My coauthor Bob Berrens and I are deep into bridges right now. The literal physical objects that get you from one side of a river to the other. You can’t build a city on a river valley floor without confronting the collective action challenge of bridges.

Who builds (read “pays for”) them? Where do you put them?

In the 1920s, people in Albuquerque engaged in political struggles between neighborhoods that wanted bridges. Sixty-seventy years later, there were political struggles based on communities that didn’t want them.

Defining “water policy”

Bridges are not the only example of our attempt in Ribbons of Green to embrace an expansive definition. We’re writing about parks and recreation. We’re writing about evolving cultural relationships with the Rio Grande, including deep and diverse relationships with the act of irrigating and growing food. We’re writing about trees, and fish.

I’m reading Rudolfo Anaya right now. His characters go down to the river. That’s admissible evidence.

Establishing parks, and building bike trails, helps shape a community’s relationship with the river. That’s water policy.

Building fences to keep kids from drowning in irrigation canals helps shape a community’s relationship with the river. That’s water policy too.

Protecting wetlands? Water policy.

Regulating waterfront development (either encouraging it or prohibiting it)? Water policy.

Cutting down trees along an irrigation ditch to conserve water (or leaving them there as shade for the ditch walkers)? Water policy.

Fishing rules, canal trails, historic preservation and commemoration of the old canal headings at Atrisco? Water policy.

All of these things have a common characteristic: they reflect the tradeoffs we must make, the often competing and conflicting values we must articulate, things lying at the intersection of economic resources, ecological resources, and public infrastructure that define what Albuquerque has become as a modern city.


In Albuquerque, a record for July unpleasantness

Graph with white background, green line showing rising average Albuquerque temperature for July since 1891

Courtesy xmACIS

July is, in general, Albuquerque’s hottest month. This year’s was the hottest July we ever had.

All kind of weather records….

  • Average overnight low of 72.3F was the warmest for that measure in a dataset going back to 1892.
  • Total measured precipitation at the airport, our official measurement station, was just a trace – tied for driest since 1892.
    • With a similar record for June (tied with a bunch of “T’s” in the record) this is driest summer “rainy season” we’ve had since record-keeping began
  • Average high of 99F was a smidge below 1980’s record 99.1

It’s worth noting what my econometric colleagues would quickly point out here as “colinearity” – these aren’t fully independent variables. This is the point where I smile, nod knowingly, and leave the details to smart graduate students.

Yesterday (July 25, 2023) was the hottest day in Albuquerque history

By one measure of overall heat, yesterday (July 25, 2023) was the hottest day ever recorded in Albuquerque.

This is a tricky one, the sort of extreme I used to love back in my newspaper days when I needed a hook to slip stories like this past the filter of my editors. The daytime high of 103 was a daily record – the hottest July 25 in records going back to 1891.  (Can confirm that my bike commute home at 5 p.m. was unpleasant.) But it fell well short of the all time high, 107, on June 26, 1994.

But in a note sent around to CoCoRaHS observers, Michael Anand of the National Weather Service’s Albuquerque office did the full weather nerd thing for us, noting that the daily average temperature of 90 – the mid-point between overnight low and daily high – was the hottest by that measure in that aforementioned history of more than a century of record keeping.

Other records of note:

  • driest start to a summer monsoon, as measured by total measured rainfall at the official airport station since June 15 – just a trace
  • on track for hottest July ever, based again on that overall daily average temperature
  • longest streak of temperatures never dropping below 70 – 12 days, ending July 21
  • longest streak of daytime highs over 95 at 24 and counting (based on the current forecast, we’re gonna add at least 7 more days to that record)

But Michael’s news is not all bad!

Good news is that we are looking at indications of the high pressure responsible for the extreme heat to gradually weaken and shift east over the Great Plains early to mid next week allowing for temperatures to cool closer to normal for this time of the year as well as allow some monsoon moisture to enter western and eventually central NM! Let’s hope this signal pans out!