Stuff I wrote elsewhere: court rules against New Mexico water transfer

From Saturday’s newspaper, my story about a state court ruling against a proposed groundwater transfer case in New Mexico:

State officials made clear Friday that, while they ruled against this application because of its failure to specify where and how the water would be used, they do not in general oppose water transfers around the state.

Such transfers are frequently mentioned as a way to meet growing needs in the Rio Grande Valley. D.L. Sanders, lead attorney for the Office of State Engineer, encouraged the Augustin Plains Ranch group to file a new application that meets the state’s legal requirements.

“We’re in favor of promoting innovative ideas like this,” Sanders said.


So what exactly do we mean by “drought”?

The Sheffield et al drought paper in Nature that I blogged quickly about a couple of days ago has triggered all kinds of fascinating discussion among folks in the southwestern US “drought community” (yes, there is such a thing). In brief, Sheffield and colleagues argue that a careful application of the Palmer Drought Severity Index suggests that there has not, in fact, been a discernable global increase in drought over the last 60 years.

There’s been some pushback from other researchers who have been using PDSI and coming to a somewhat different conclusion (see Aigua Dai here, for example). This suggests to me that, at the very least, PDSI’s sensitivity to the inputs that lead Dai and Sheffield to such different conclusions should give those of use who have been using it as something of a black box (I’m looking at me) some pause.

But more importantly for my purposes as a communicator, the discussion about the paper has served to reinforce the problem with the word “drought”, which is often used loosely (I’m looking at me) without care to delineate what sort of drought, with what sort of effects, we’re talking about. This recalls a 1985 review by Wilhite and Glantz that found 150 definitions. Here there be communication dragons.

Insofar as “drought” means variance on the dry side from the norm, but the norm in at least one key variable (temperature) is changing, what are we to with the statistics, and also with the word?

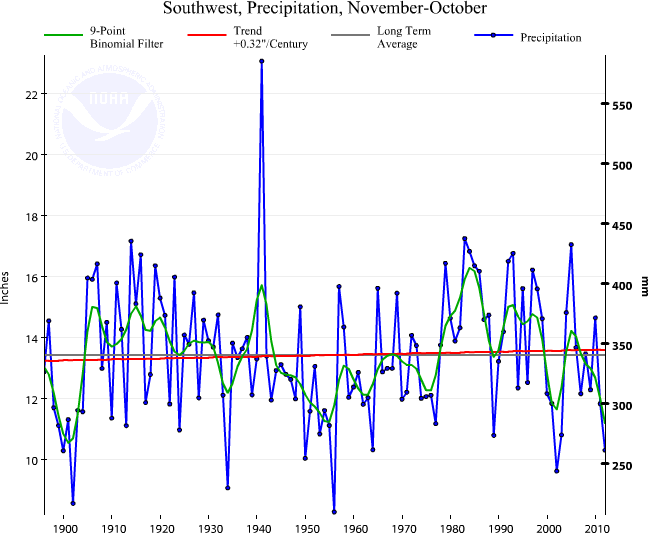
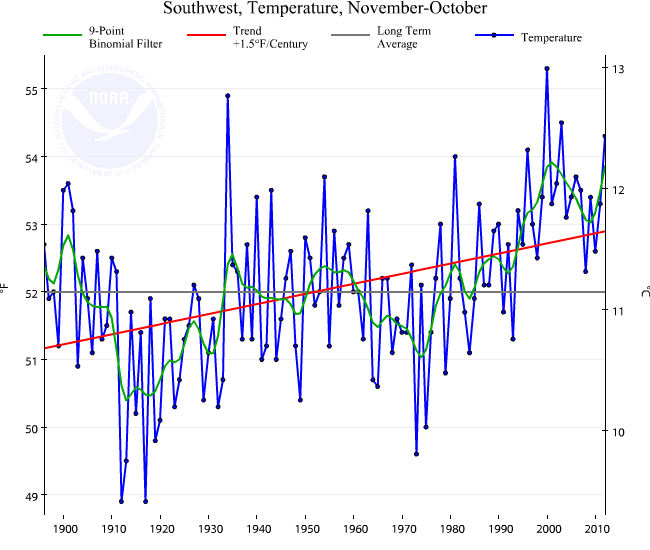
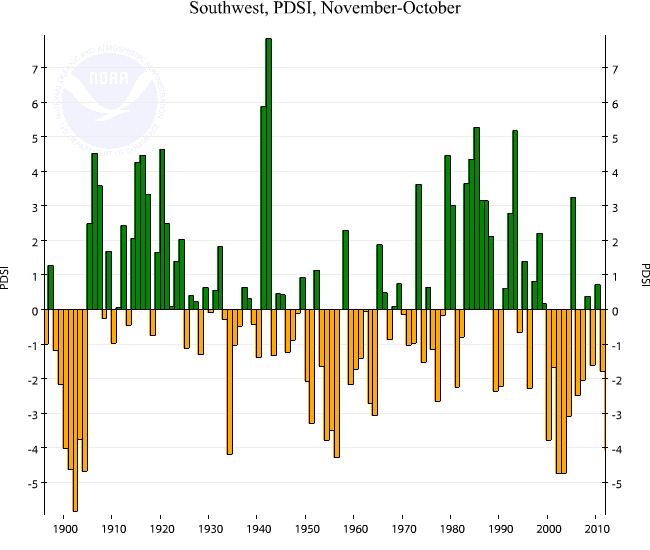
As a conversation starter, here’s some basic data on “drought” for the southwestern United States (Utah, Colorado, Arizona and New Mexico).

Precipitation

Precipitation

Temperature

Temperature

Palmer Drought Severity Index

Numbers represent 12-month averages, ending October (the most recent data). Data courtesy NCDC.

Some good news today on climate change: less drought than we thought

A new paper in today’s Nature by Justin Sheffield and colleagues suggests we’ve been using simplistic calculations that have overestimated the increase in drought globally over the last 60 years in response to greenhouse warming. Scientists typically use the Palmer Drought Severity Index, a bit a statistical black box that bases its drought estimate on a formula that combines precip and temperature data with normals for the geographical spot in question. Using PDSI, people have calculated increasing global drought as a result of global warming.

Sheffield and colleagues argue PDSI is too simplistic to capture what’s really going on:

More realistic calculations, based on the underlying physical principles8 that take into account changes in available energy, humidity and wind speed, suggest that there has been little change in drought over the past 60 years.

From an accompanying Nature “news and views” piece by Sonia Seneviratne:

The findings imply that there is no necessary correlation between temperature changes and long-term drought variations, which should warn us against using any simplifications regarding their relationship.


How the US-Mexico Colorado shortage/surplus sharing deal works

When the federal government and the seven US states that share the Colorado River signed their 2007 “Interim Guidelines for Lower Basin Shortages and the Coordinated Operations for Lake Powell and Lake Mead,” the final Record of Decision (pdf) included several chunks of legalese to the effect that the deal, while binding on the US side of the border, should not be interpreted as having any effect on sharing (or not sharing) of water across the US-Mexico border:

The United States will conduct all necessary and appropriate discussions regarding the proposed federal action and implementation of the 1944 Treaty with Mexico through the International Boundary and Water Commission (IBWC) in consultation with the Department of State.

That consultation’s been underway ever since, and we’re about to see the fruits of the discussion in the form of Minute 319, an addendum to the 1944 Treaty Between the United States of America and Mexico: Utilization of Waters of the Colorado and Tijuana Rivers and of the Rio Grande (pdf).

Under the current, pre-Minute 319 state of affairs, Mexico is entitled to 1.5 million acre feet of Colorado River water each year, along with some fuzzy treaty language that in “extraordinary drought” (whatever that means – it’s not defined), Mexico will have its water reduced the same as everybody else.

There’s a lot in Minute 319, much of it which I don’t yet understand (we haven’t seen the actual language, just incidental documentation). I’ll stick here to the details of the shortage and surplus sharing. Here’s how it works.

Under the 2007 Interim Guidelines, the level of Lake Mead is used as a trigger for reducing water allocations to the Lower Basin states. When Mead’s surface hits 1075 feet above sea level, the total Lower Basin allocation is cut from 7.5 million acre feet to 7.167 maf, with the shortage shared between Arizona and Nevada. When it drops below 1050, there’s a deeper cut, to 7.083 maf (also Arizona and Nevada take the hit – California’s senior rights on the river trump here).

Under Minute 319, Mexico now joins in the droughty fun, seeing its 1.5 maf cut by 50,000 acre feet when Mead’s below 1075. Below 1050, Mexico takes a 70,000 acre foot hit.

On the flip side, Mexico now also has the opportunity to share in surpluses. When Mead is above 1145 feet above sea level, Mexico gets an extra 40,000 acre feet of water. Above 1170, an extra 55,000 acre feet. Above 1200, an extra 80,000 acre feet.

There’s much more to the deal, including an expansion of Mexico’s ability to store water in US reservoirs, and environmental flows in the Colorado River Delta. I’ll try to avoid writing about that stuff until I actually understand it. In the meantime, here are some links to more information:


nota bene: population growth in the West’s urban archipelago*

Just the blog equivalent of thinking out loud here. It’s not that this data was surprising to me, so much as that I wasn’t sure what to expect.

Four cities in the western United States with some similar characteristics – arid climate, water supply challenges, growing populations. Each of the four is the dominant population center in an otherwise sparsely populated state. No claim here that other cities don’t have similar characteristics (in fact, I’d love feedback on other cities/states worth adding to the conversation).

First: total population in the Census-defined “Metropolitan Statistical Areas” since 1970:

Population

Population

Now, indexed with 1970=100, to get a feel for rate of growth independent of starting size:

population, indexed

population, indexed

It’s really this second one that interests me more – the relative growth curves are easier to see. Albuquerque and Salt Lake City growing slowly, Phoenix faster and Vegas’ growth curve bending up dramatically beginning in the late 1980s. This has all kinds of importance for water policy and regional economics. Though I’m not sure what to make of it all, just wanted to get it down somewhere for future reference.

If I’ve done this right, the spreadsheet’s posted here if anyone wants to have a look. Data source is US Census Bureau via the St. Louis Fed’s marvelous Excel plug-in and some math by me to aggregate MSAs from individual county data (danger!).

* I stole the “archipelago” concept from a talk by Mark Hagerty of Headwaters Economics, though his archipelago looks quite different from mine. But what we both mean, I think, is “economic islands in the sea that is the rural West”.

Oh, he meant those junior wells

At a water board meeting this afternoon, the attorney mentioned “Junior Wells”. My mind wandered:

Turns out that wasn’t what he meant:

During litigation involving one of the largest water plans developed in recent years, it was discovered that about 60,000 acre feet per year were being taken by junior wells from the South Platte while senior rights were short of water.

Oh, that junior wells.

Water transfers: the view from downstream

A small but interesting water law/politics/policy case is emerging in northern New Mexico, involving a request by a Sangre de Cristo mountains ski area to use more water for its snow-making equipment. This is the sort of case that hinges on the withdrawal/consumption distinction – how much water a user withdraws from the system, versus how much is actually consumed.

Sipapu Recreational Development ll, LLC, which runs a small ski area, wants to use more water from the Rio Embudo watershed to make snow. The watershed collects snowmelt from the Sangres, the southern branch of the Rocky Mountain spine that slices down into New Mexico past Taos before petering out east of Santa Fe. The Embudo eventually flows into the Rio Grande. To make up for the effect of its snow-making on downstream flows, the folks at Sipapu want to buy water rights from the San Juan-Chama project, which imports Colorado River Basin water beneath the continental divide and dumps it into a different Rio Grande watershed – the Chama, which flows in from the west.

It’s essentially removing water from one part of the basin, and replacing it with water in a distant part of the same basin. The basin in its entirety is thus made whole, the ski area operators’ application contends. But the ensuing argument will be over whether that is enough.

If the math in the Sipapu application is right, the Rio Grande will eventually be made whole – water used up on the ski slopes will eventually be replaced downstream. But the folks in the middle – users of the old acequia systems in the Dixon/Embudo Valley – have a couple of problems with this.

La Jicarita, which covers northern New Mexico, posted the farmers’ protest, filed last week with the New Mexico Office of State Engineer. Their argument is twofold. First, they question the withdrawal/consumption calculation used in Sipapu’s calculation. The ski area people want to take 350 acre feet of water during the early ski season to make snow. Based on their “consumptive use” calculation, the Sipapu application, as I understand it, assumes about 28 percent of that is “consumptive”, evaporating or sublimating, lost to the system, which the rest of the water will eventually flow past the farmers’ headgates downstream. As a result, they argue that they only need to “offset” 100 acre feet of 350 acre feet of water they are using. From the protest:

We … question the figure of 28% consumptive percentage. To our knowledge, that figure was derived from a Colorado ski area study in 1990. The altitude and latitude there do not correspond to the geographic characteristics of Sipapu, and the climate was different 22 years ago. We are in a climate phase of increasing temperature and decreasing humidity. Unless the consumptive percentage is calculated currently, and specifically in Sipapu or in a place similarly situated in altitude and latitude, we do not regard the figure as valid.

Secondly, the full withdrawal matters here as well. Water not consumed in the rural agricultural mountain hydrologic system is nevertheless water being “used” in a very real and important sense. Again, from the protest:

Despite the published comments of Sipapu’s General Manager, John Bradley, the river is not “just flowing down the canyon in the late fall”. We are still irrigating in November. We are planting overwintering crops like garlic, and cover crops, and irrigating our orchards. In addition, the river is providing our drinking and household water from the saturation zone around the Rio Pueblo-Rio Embudo waterway. The 350 acre-foot withdrawal in November and December will diminish our irrigation flows, make the saturation zone drier and diminish the plume of underground water from the river which replenishes our wells. Wells going dry are already a problem in our area, and this action would exacerbate the problem. In addition, the drier saturation zone will need more water in the spring to re-saturate it, and that will reduce river flows available for irrigation.

For more background, Kay Matthews at La Jacarita has an excellent overview of the issues.
Heineman-Fleck house monthly climate report, now with new improved PRISM data

If you needed another prod to sign up as a CoCoRaHS weather observer, now you can get PRISM data for your own neighborhood.

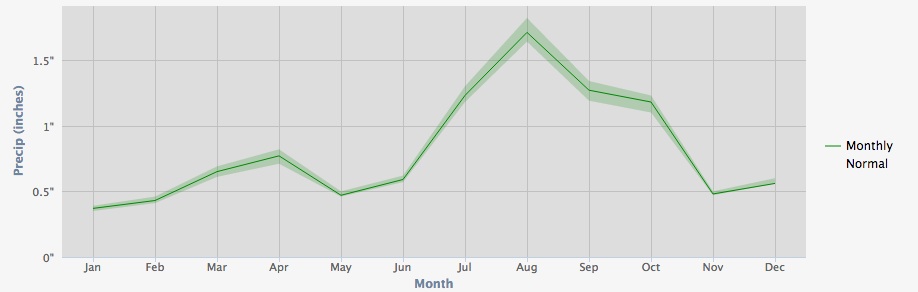
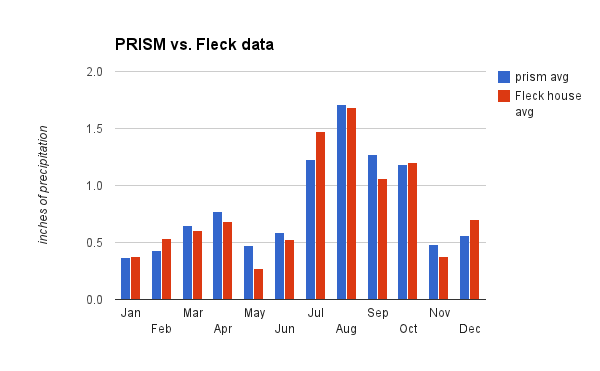
I’ve got 13 years of precip data for my house, first as part of the Albuquerque National Weather Service’s CityNet program, and now as a CoCoRaHS observer. But 13 years is too short a time period to calculate a meaningful average. Now, thanks to the new PRISM data, I have a clearer idea of what the long term looks like in my neighborhood:

Average monthly precipitation, Altura Park neighborhood, Albuquerque

Average monthly precipitation, Altura Park neighborhood, Albuquerque

That’s a PRISM estimate of average monthly precip during the 1981-2010 period now in use for US “climate normals”. You can see that October is usually one of our wetter months, averaging 1.18 inch (3 cm). This year I had 0 inches (0 cm).

Here’s the PRISM data compared to my shorter record:

PRISM 1981-2000 averages compared to Fleck 1999-2012

PRISM 1981-2000 averages compared to Fleck 1999-2012

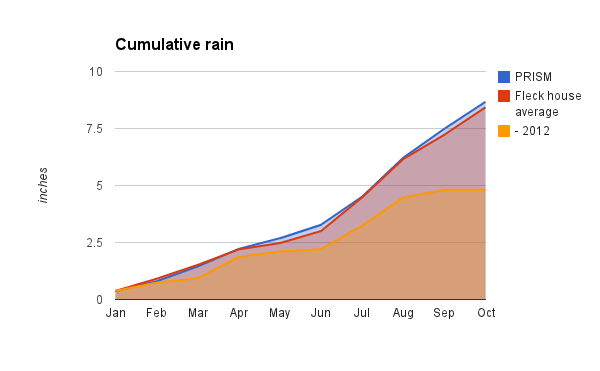
For the first ten months of the year:

  • 2012: 4.81 inches (12.2 cm)
  • my period of record average: 8.43 inches (21.4 cm)
  • prism average: 8.67 inches (22 cm)
Cumulative precip

Cumulative precip


on solving water problems

There’s a tendency, when confronted with water problems, to try to specify solutions: If only we’d junk those golf courses and stop watering our damn lawns so much! Why are we wasting our precious water growing alfalfa in the desert! We must reduce exports from the Sacramento-San Joaquin Delta! Water markets!

In a post last week, veteran Kansas water manager Wayne Bossert had a great summary of a talk by Bill Blomquist (student of and collaborator with the late Elinor Ostrom) that lists eight characteristics of successful efforts to share common pool resources. Notice that, rather that banning golf, this is about putting in place the institutional framework so folks can come up with workable and sustainable solutions (including, if they so desire, the decision to ban golf). As a water numbers nerd, my particular favorite is number 2:

Shared information. All the participants must be able to understand, transfer and communicate data, goals, interests, current use levels and all the other parameters needed for understanding the situation.

But if you’re in the midst of a tangled water policy/politics battle, the entire list is essential reading. How many item’s on Wayne’s list does your current water process have? If you don’t have ’em, it’s unlikely that you’re going to succeed at this, I fear.

A summary of Blomquist’s talk is here (pdf). A book worth reading on all of this is Ostrom’s Governing the Commons.