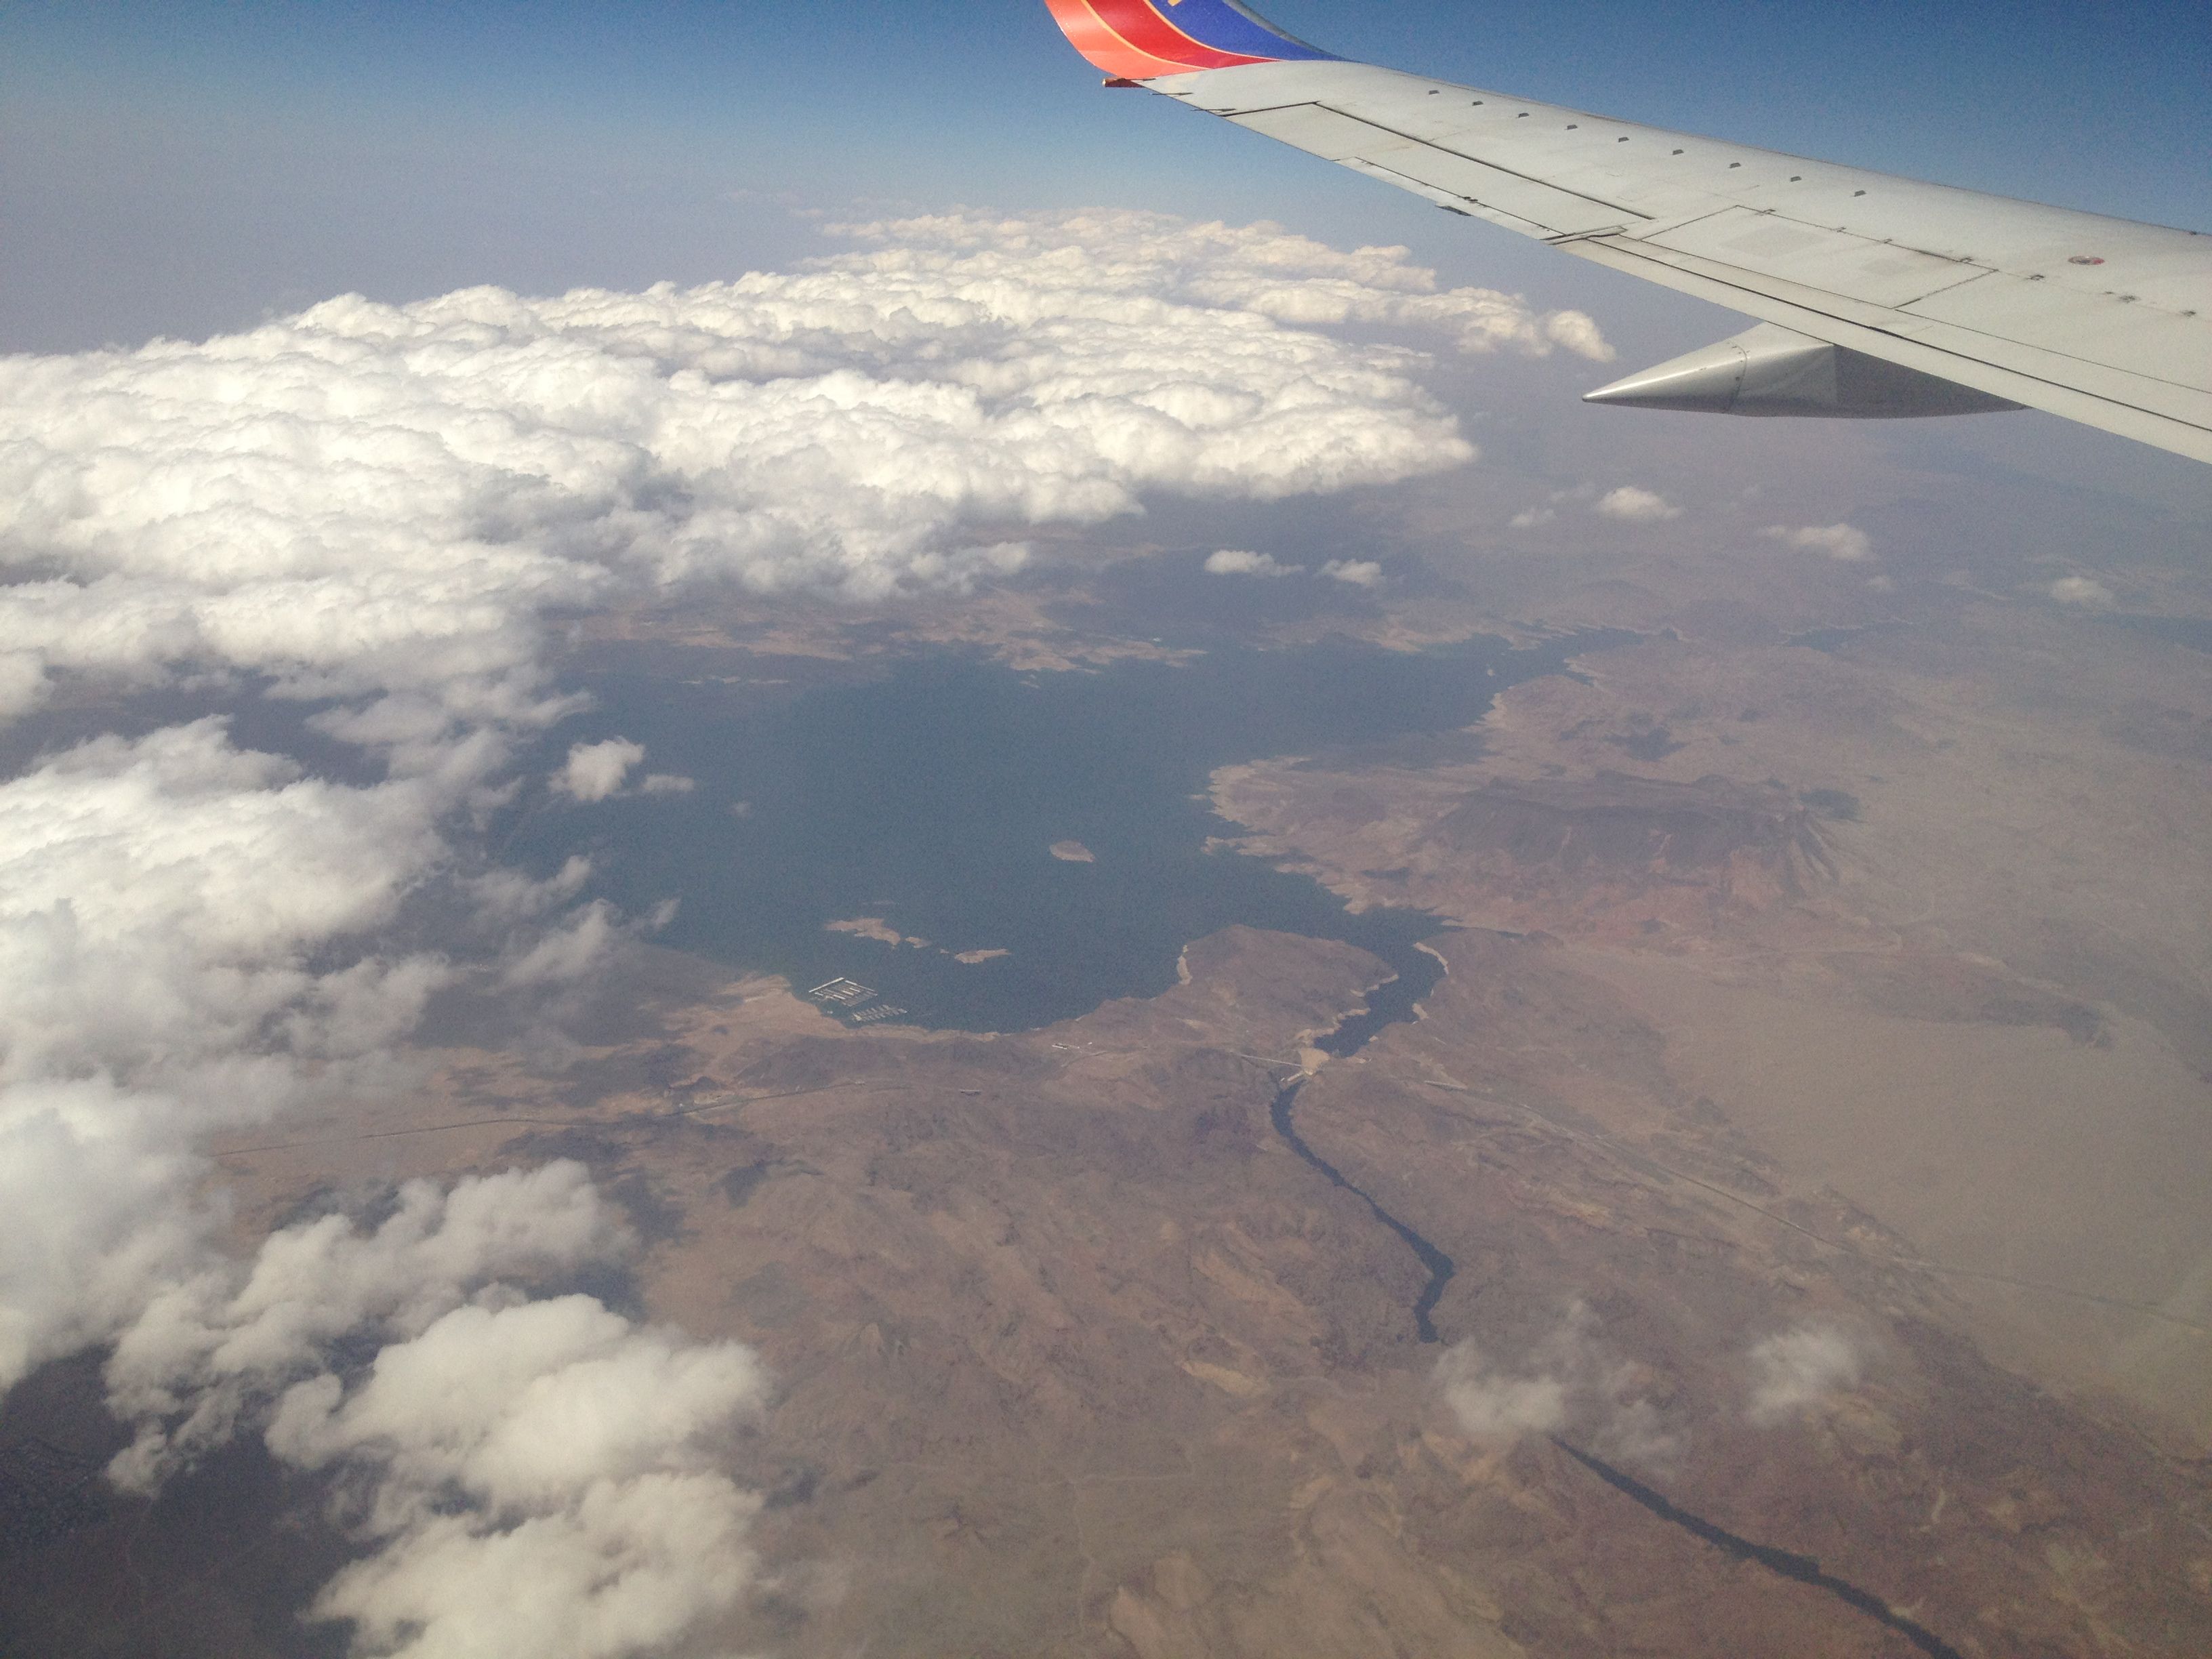
In Arizona, a Colorado River shortfall would hit ag first

What’s the Colorado River failure mode? By which I mean, with as much specificity as we can muster, when the water begins to run short, who will get less? I’m pushing this question because of a frustration with the doom scenarios generated by simply extrapolating the diverging supply and demand curves forward in time and invoking Anasazi/Hohokam portents of doom.

I’ve pointed a couple of times recently (here and here) to the risk faced by Arizona and Nevada. Juliet McKenna and her colleagues have usefully added to the discussion with a more detailed look at the pecking order within users of Arizona’s Central Arizona Project supply of Colorado River water:

M&I (municipal and industrial) subcontractors are in a relatively secure position for the next 25 years, while agricultural and other users of “excess” CAP water should continue to prepare for frequent, and perhaps sustained, reductions.

This gets to the critical question of how, in a very practical manner, shortage will spread through the basin. If there’s not enough water in the river to meet all needs, the “law of the river” will determine allocation among the various states. Each state will then be responsible for allocating shortage within its boundaries. McKenna’s analysis shows that ag holds the short straw in Arizona.

Science literacy, numeracy and science policy challenges

Dan Kahan, the Yale “cultural cognition” guy, has a new paper highlighting the problem with the argument that a more scientifically literate public will solve all our scientized problems, things like climate change, GMOs and nuclear stuff where the scientific argument has become intractably embedded in a political context.  (The paper’s actually targeted at climate change, but I think the argument extends to a much broader sphere.)

The paper’s in Nature Climate Change, and Dan’s done a nice summary on his blog:

We find that individuals who display high comprehension of science (i.e., those who score higher in science literacy and numeracy) are in fact more culturally polarized than those who display low science comprehension.

I’ve commented before on how these data relate to the popular surmise that seeming public ambivalence toward evidence on climate change reflects the predominance of what Kahneman (in his outstanding book Thinking: Fast & Slow, among other places) calls “system 1” reasoning (emotional, unconscious, error-prone) on the part of members of the public.

Our findings don’t fit that popular hypothesis. On the contrary, they show that individuals disposed to use system 2—conscious, reflective, deductive—reasoning (a disposition measured by the numeracy scale) are even more culturally divided than those disposed to use system 1.

This stuff is very much on my mind after participating in one of the most useful conference panel discussions I’ve ever done last week at the Tahoe Science Conference.

Tamara Wall from the Desert Research Institute invited me, and based on the initial discussions I assumed I would be playing my usual “science communicator” role. This is where scientists who’ve seen me successfully write about their work (or so they think) invite me in to explain how they can better get their point across to a sometimes recalcitrant public. I used to enthusiastically jump at these opportunities to explain how it’s done. These days I’ve adopted the glum “science communication is harder than you think”, “the deficit model doesn’t really work, and even if it did, I’m not gonna be able to fix the deficit”, etc.

But Wall was one step ahead of me. In addition to the climate scientist on the panel (David Pierce from Scripps, who ably explained how scientists approach the problem of attributing climate change to natural and anthropogenic causes), she invited two social scientists. Patricia Mynster at UNLV is doing field work on understanding and attitudes toward climate change among residents of rural northern Nevada. Kim Klockow at the University of Oklahoma is applying Kahan’s “cultural cognition” framework to people’s perceptions of weather and climate.

So when we were eating dinner the night before scheming about the panel, and Klockow brought up Kahan’s work, I’m thinking to myself, “Wait. You mean I’m not going to have to explain the science behind why my work is received in such varied ways?”

To say that I was happy is an understatement. I usually feel kinda lonely at these things.

On the Colorado, chance of surplus early, shortage down the road

I know it is in the mission statement of all card-carrying western water journalists to harp on the gloomy prospects of shortage. But in the near term, the odds of a surplus on the Colorado River are greater than the chances of a shortage, according to new calculations by the US Bureau of Reclamation.

Don’t worry, though, I’ve still got a gloom card to play, as by 2019, the lines cross, and there is a nearly 50 percent chance of shortage by 2026.

The new calculations are based on the current forecast for storage in the big reservoirs of Lake Mead and Lake Powell at the end of this year, and use an ensemble of possible wet years and dry years, based on the 1906 – 2008 flow record.
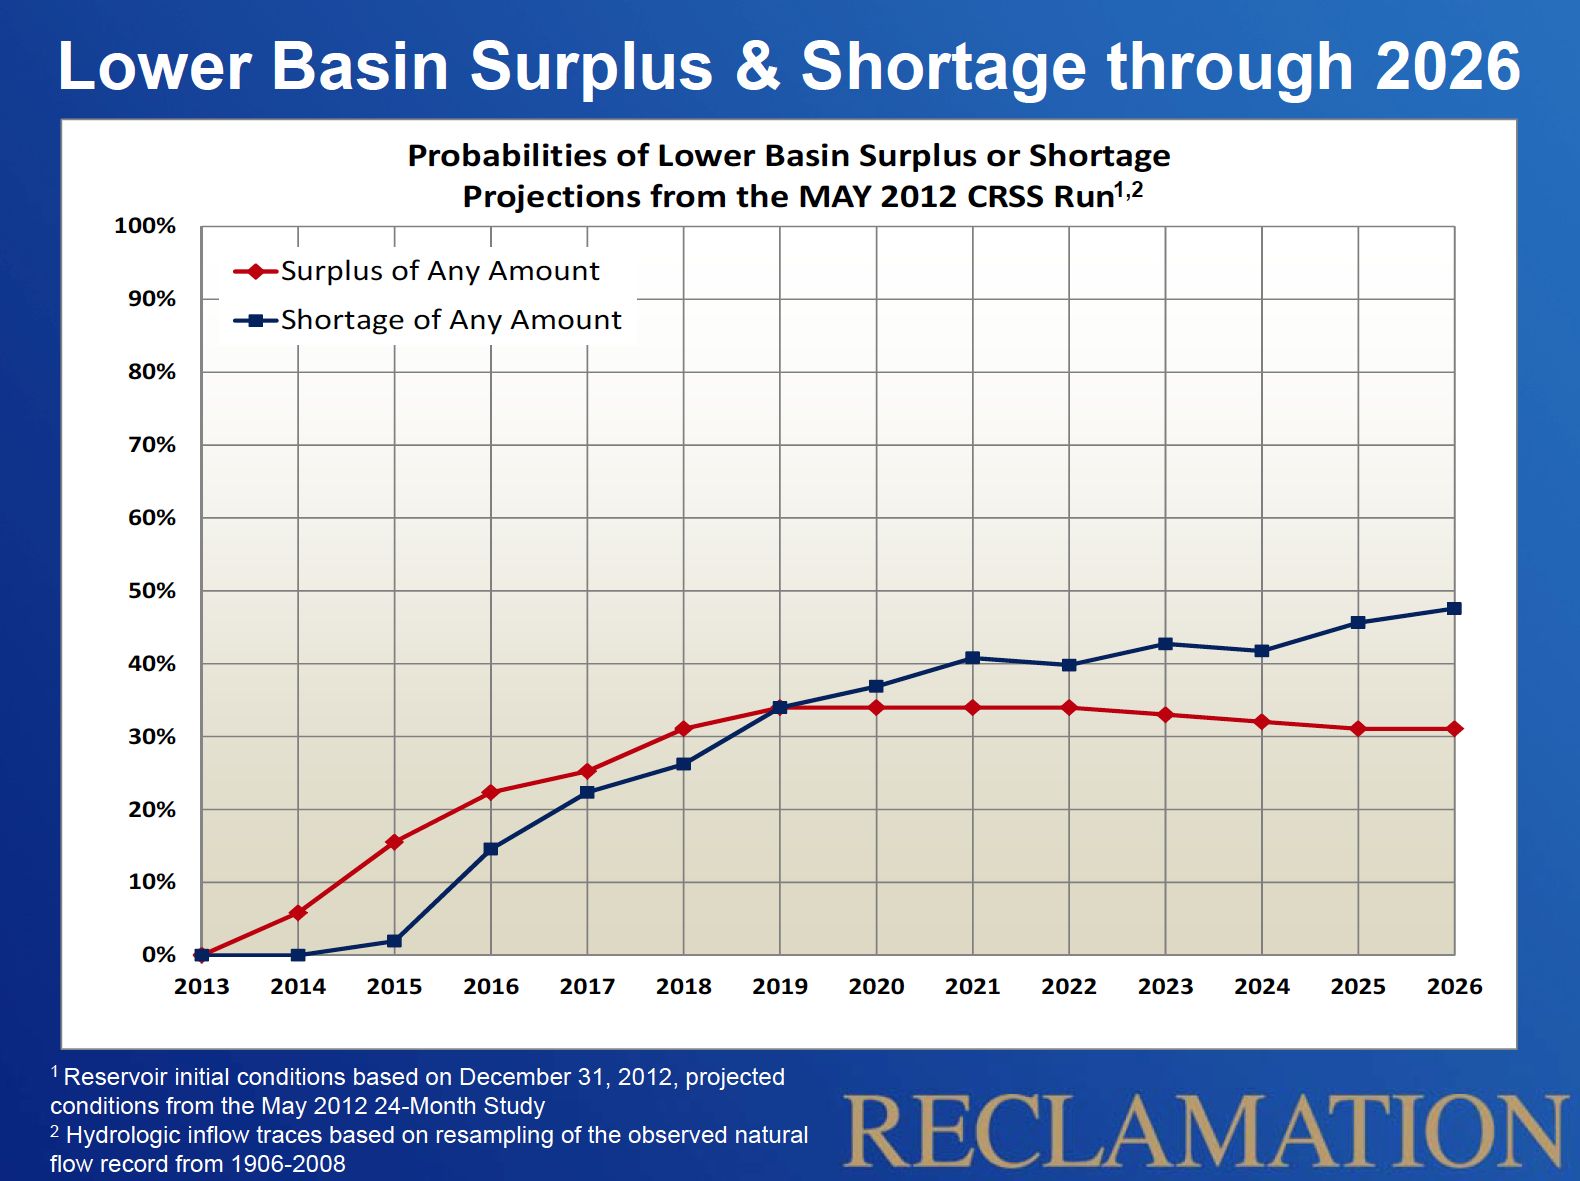
Odds of Shortage and Surplus on the Lower Colorado

Odds of Shortage and Surplus on the Lower Colorado, courtesy US Bureau of Reclamation

We have to be careful to define exactly what we mean here by “shortage” and “surplus”. These are terms that are defined with Byzantine precision in the Colorado River Interim Guidelines for Lower Basin Shortages and the Coordinated Operations for Lake Powell and Lake Mead. A shortage occurs when Lake Mead’s surface elevation drops below 1,075 feet above sea level. As I’m writing this, it’s at 1,119.85, and it’s forecast to end the calendar year (the starting point for this calculation) at 1,118.26, per the latest monthly forecast (pdf). So another 33 feet until a “shortage” is declared, at which point Nevada (really Las Vegas) and Arizona see supply reductions.

Surplus is defined as Mead rising to about 1,145. We don’t talk about this as much, because we like to be all scary and drought-mongering, but as you can see from the graph there’s a greater chance of surplus than of shortage over the next few years. In a surplus condition, Arizona, Nevada and the Metropolitan Water District of Southern California all get bonus water. The last time Lake Mead had that much water was 2003.

The caveat – this calculation is the odds if past is prologue – that is, if the past range of variability over the previous century captures the variability we’re likely to see. To the extent climate change may be at play in the near term, you should adjust your thinking accordingly (push the shortage graph up a bit, and the surplus graph down a bit?).

The graph goes out to 2026 because that’s the “interim” in “Interim Guidelines”.

The Upper Basin doesn’t show up here because we Upper Basin users (I’m drinking Colorado River water here in Albuquerque as I write this) aren’t covered by this whole shortage/surplus scheme. We’re still not using our full share of the river’s water, so don’t worry about us, we’ll be fine.

Thanks to Carly Jerla and Paul Williams Miller at the Bureau for kindly sharing the graph, which Paul included last week in his presentation at the Tahoe Science Conference.

update: fixed error in Paul’s name – apologies to Paul for getting the name wrong, and thanks to an anonymous reader for pointing it out
Making a map

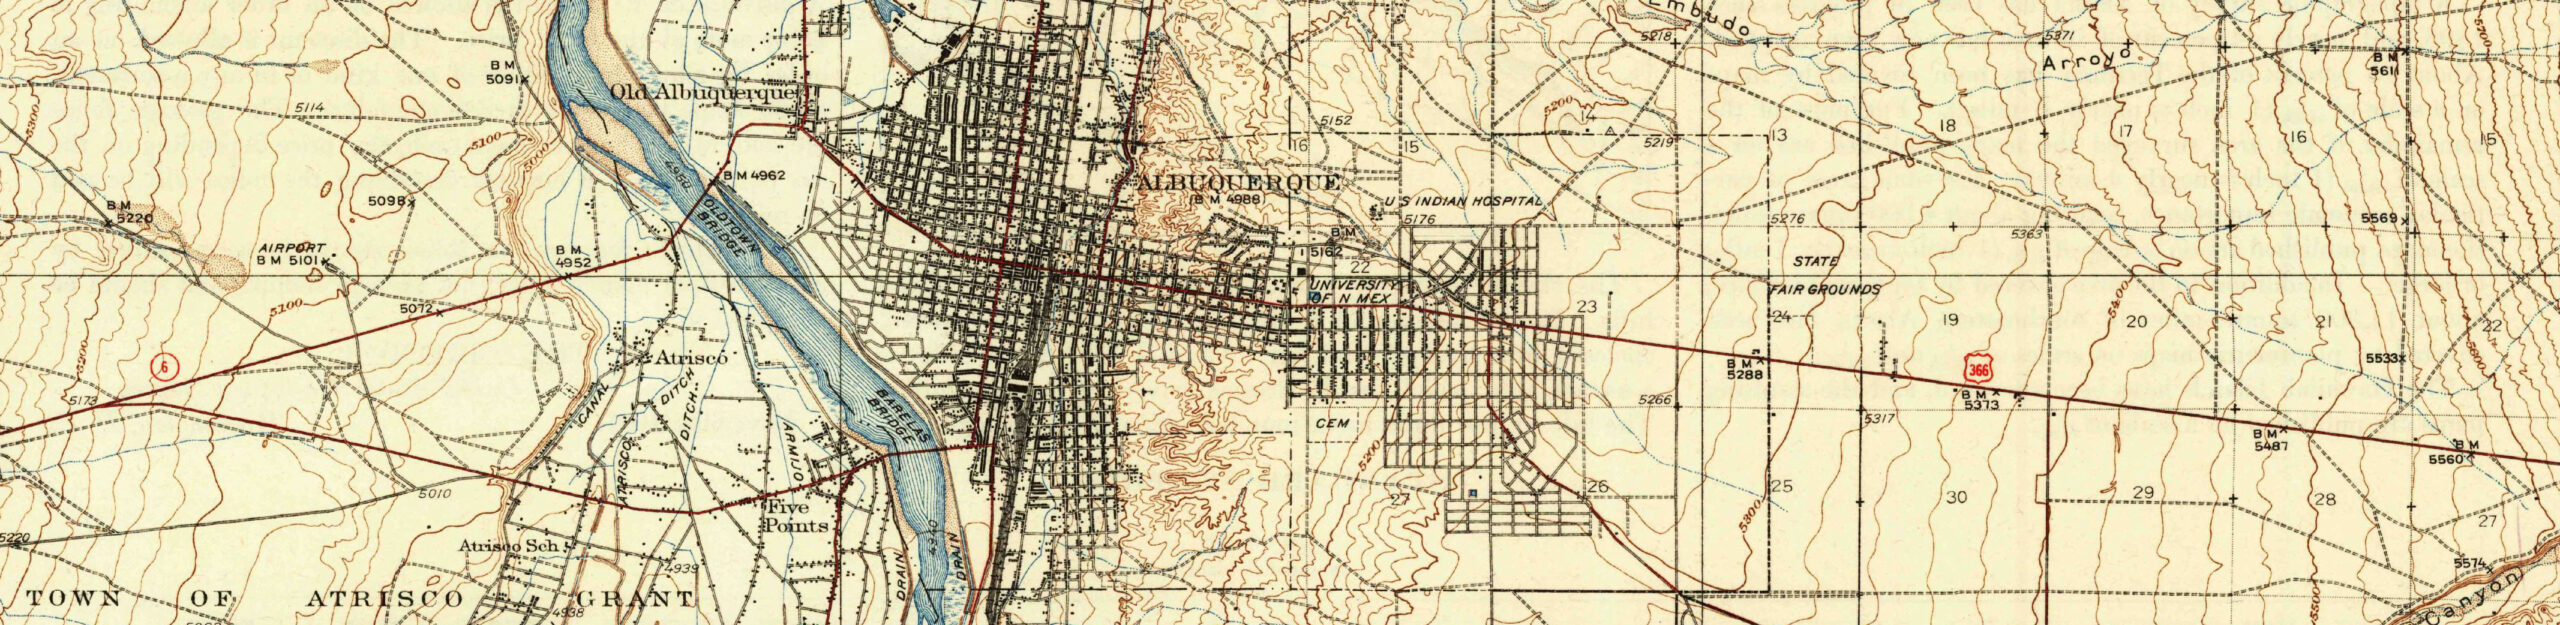
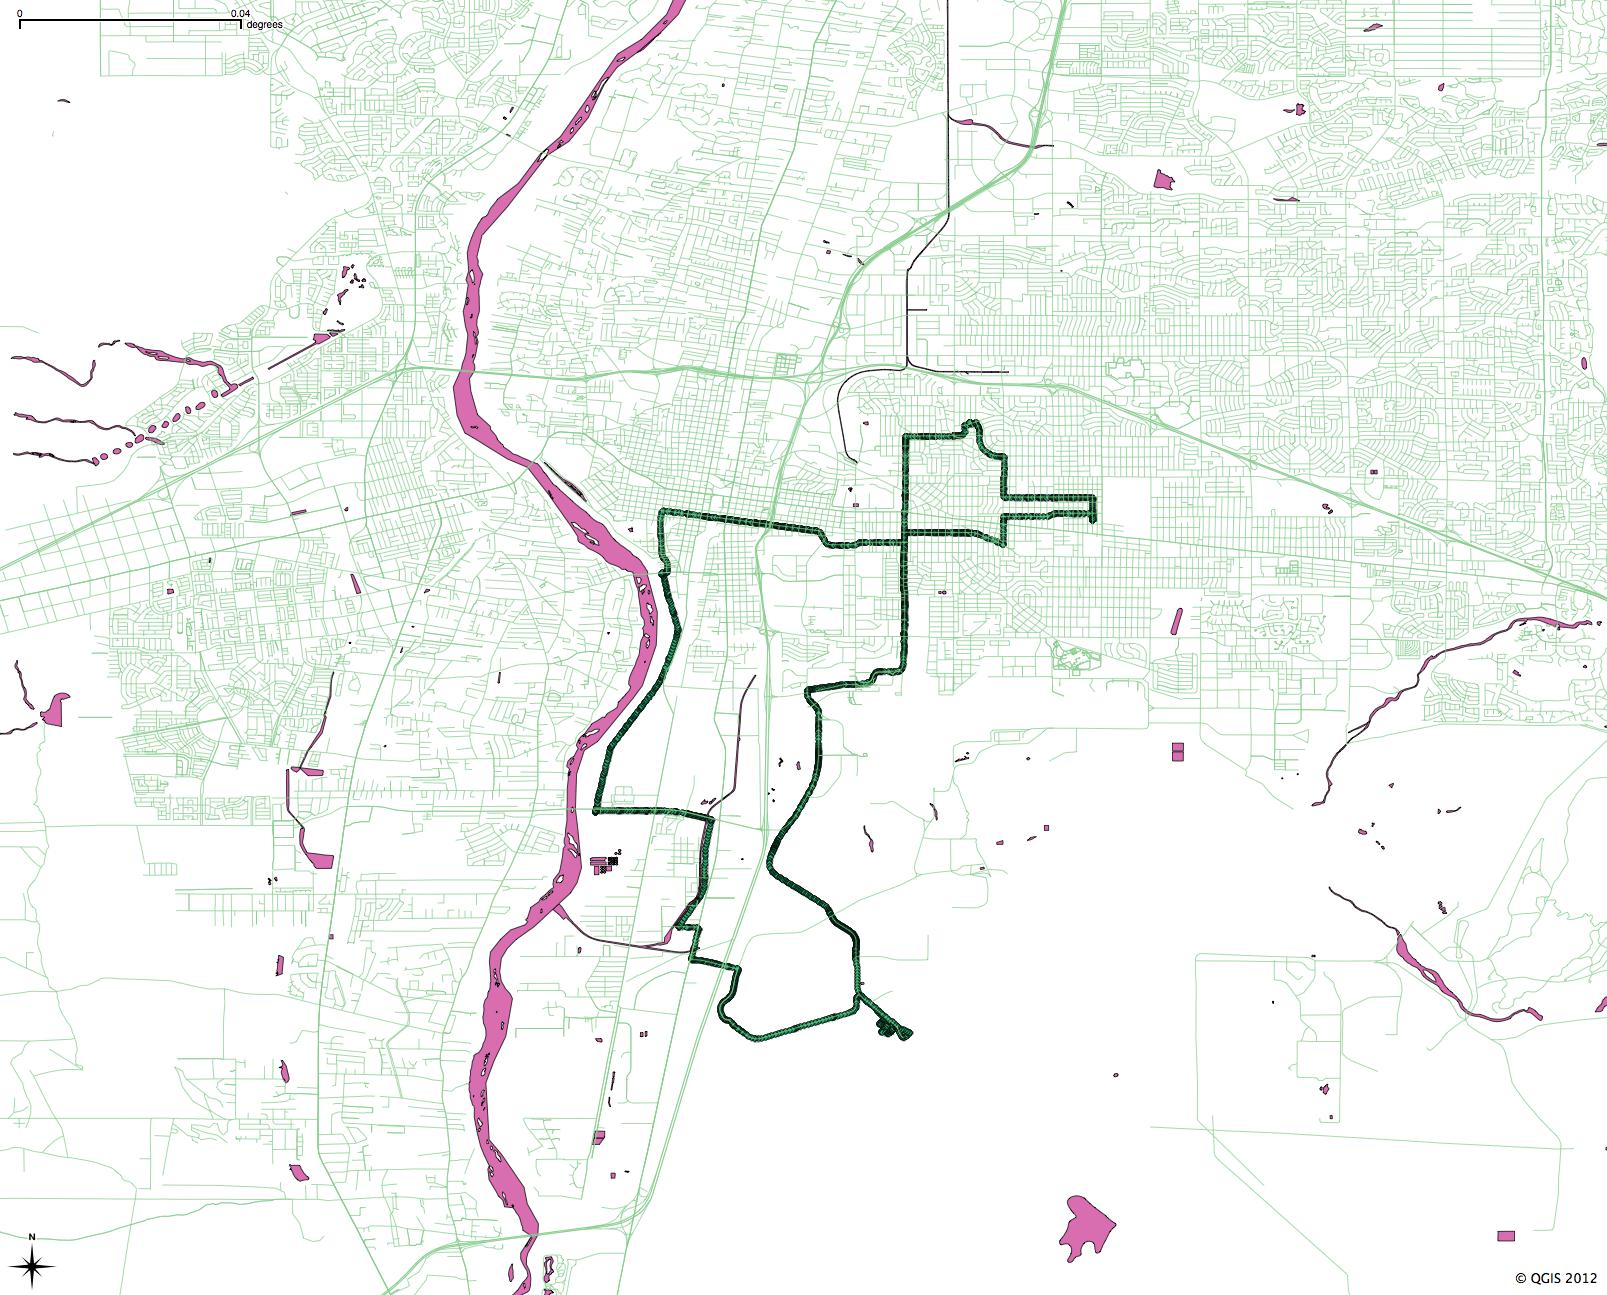
Inspired by the beautiful maps Geoff McGhee made for the Lane Center-KQED California Delta project, I spent some time this weekend playing with GIS software. I haven’t done any hackerly projects in ages, and a friend who’s a GIS professional had suggested QGIS, a free software project. (ArcGIS is pricey, and I’m a Mac guy at home.) The real driver here is a desire to use maps to better understand the subjects I’m writing about, and to better incorporate them into my published work.

OK, the real driver is I love to play with software? Whatever.

Herewith, one of my first maps, using Bernalillo County road and water base maps from Census TIGER files, plus the GPS trace from this morning’s bike ride:

bike ride, May 28, 2012

bike ride, May 28, 2012

El Paso cranking up the desal

The central premise of my book project is that, despite the enormous western water problems I regularly chronicle here and in the various other places I publish, I expect that we’ll do OK in the long run. My optimism comes from the way communities, when they approach the edge of the water supply cliff, show the ability to adapt to shortage.

One of my favorite case studies is El Paso, which in the face of some pretty nasty drought conditions is cranking up its desal plant. From El Paso Inc.:

For the first time since it opened in 2007, El Paso Water Utility’s desalination plant has been running at nearly full capacity this month.

And without it, the city would have been in trouble, the utility’s president and CEO, Ed Archuleta, said Friday.

“People have asked me when the desal plant is going to run at full capacity,” he said. “Well, here it is. If we didn’t have that plant, we would be in deep trouble in that part of the city.


Hoover Dam from above

Hoover Dam from above, 5/25/2012

Hoover Dam from above, 5/25/2012, by John FLeck

I believe that anyone who flies in an airplane and doesn’t spend most of his time looking out the window wastes his money.

– Marc Reisner

When your vantage point spans a sufficient chunk of landscape, Hoover Dam doesn’t look so big. Is this really the right scale at which to think of it?

Stuff I wrote elsewhere: Kirtland jet fuel spill

I dashed out of town early Wednesday and failed to share with Inkstain readers the latest in the Kirtland Air Force Base jet fuel saga:

As much as 24 million gallons of jet fuel might have escaped from a decades-long leak in an underground Kirtland Air Force Base pipe, three times more than previously estimated, according to a new calculation by a New Mexico Environment Department scientist.

Officials cautioned that there is still a great deal of uncertainty about the number, and that they may never know how much fuel has spilled. But new data from state-mandated monitoring wells show the fuel in soil beneath the spill site is more widespread that previously known. And regardless of the specific number, the new data show the spill is larger than previously known, state officials said.

The news raised alarm bells at the Albuquerque Bernalillo County Water Utility Authority, which has two large water well fields near the contamination site. The contamination is less than two miles from the nearest well.

“It scares the heck out of me,” said John Stomp, the water utility’s chief operations officer.


Stuff I wrote elsewhere: endangered species problem highlights deeper problems on the Rio Grande

My column in the morning paper on a rift between the state of New Mexico and the feds over water for the endangered Rio Grande silvery minnow. Because it’s not really about a fish:

As has been happening for more than a decade on the Rio Grande, the minnow is merely one of the first places our long-standing, unaddressed water problems show up.

If there is not enough water in the Rio Grande for the minnow, that means trouble for farmers and cities is not far behind. If it were not the federal government right now wrestling over water shortfalls for the minnow, the situation could quickly turn into state and local governments wrestling over who is responsible for ensuring adequate water for crops, toilets and taps. The fact we have minnow problems means we have water problems.