The Sacramento Delta and the Colorado River – a comparison

Barry Nelson had an insightful post today comparing and contrasting the Colorado River and the Sacramento-San Joaquin Bay Delta systems. There are important similarities – crashing (or crashed) ecosystems and water supplies for human systems that are stretched beyond the point of sustainability. But the institutional frameworks for addressing those problems and the prospect of solutions arising from those frameworks are very different.
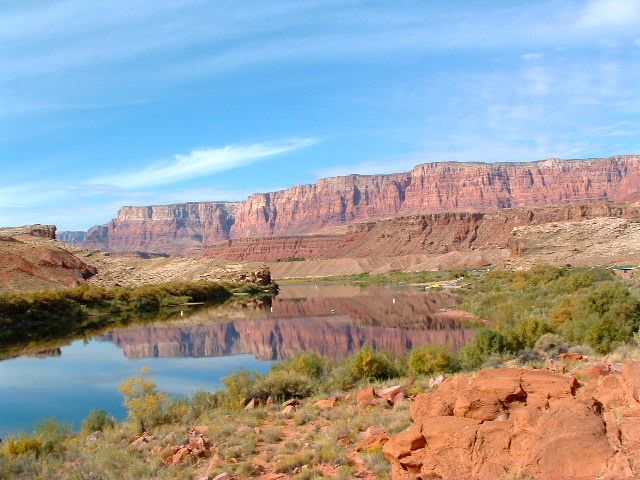
Lee's Ferry, 2005

Lee's Ferry, 2005

Oddly, as Nelson lays this out (and I agree), California in some sense has more institutional momentum behind grappling with core questions in the delta than one sees on the Colorado River. Yet I would argue (and this is me, not Nelson) that the chances of solving the Colorado River’s problems are much more realistic than the Delta.

On the Delta, Nelson points out via the recent Delta Vision report card that near term actions, things like levee upgrades, are stalling:

The Foundation also concluded that “the level of effort is impressive” on Bay-Delta issues. Why the apparent conflict between these two conclusions? In short, the Foundation concluded that there is a tremendous current investment in efforts to develop long-term solutions through the BDCP and Delta Plan programs, but that short-term actions like improving Delta levees and beginning ecosystem restoration are proceeding far more slowly than is needed.

I’d argue that the level of accomplishment is not commensurate with the level of effort on the long term Delta solutions either.

Compare this now with the short term and long term situations on the Colorado. As Nelson points out, short term successes on the Colorado are substantial:

In recent years, a great deal of effort has gone into developing near-term water management solutions, in light of the decade-long drought on the Colorado. Among these near-term solutions are water banking agreements between Nevada and Arizona and the Bureau of Reclamation’s interim guidelines regarding the allocation of shortages in the Lower Basin.

But what about the long term on the Colorado? Nelson:

The Bureau of Reclamation’s Colorado River Basin Supply and Demand Study is putting the long-term challenges in sharp focus. The Bureau’s conservative interim conclusions paint a stark picture of the challenges that would result from a status quo approach in light of the likely impacts of climate change on the available water supply in the basin.

The problem, as Nelson notes, is the lack of a framework for dealing with the grim numbers coming out of the Basin Study:

What I find interesting is that there is no well-established forum to address the Bureau’s findings that includes federal agencies, as well as all of the Basin states, water agencies and stakeholders. In short, there isn’t a well-established and comprehensive Basin-wide forum to pick up the ball from the Bureau’s Basin Study. Given the size of the basin, the diversity of the players and the scale of the challenge, such a forum is likely to be critical to developing and implementing a sufficiently ambitious long-term plan.

Shorter Nelson: Delta – big institutional framework, lack of progress. Colorado River – progress, but not much framework.

This is the same issue lingering behind Carpe Diem West’s Governing Like a River Basin report. As I wrote then, there are a variety of possible governance frameworks that might be used to begin tackling the big picture Colorado River problems…

But what remains … is the meta-process question. By what process involving the existing institutions we’ve got will some sort of solutions-oriented new process arise?

I actually am more optimistic about such a meta-process arising organically than I was when I wrote the above sentences back in December. I’m sure that some sort of uber-process-framework creation, along the lines of BDCP in California, won’t work. But Nelson noted something important regarding Colorado River processes:

I was … struck at a recent Colorado River conference by the commitment among agencies and stakeholders to develop workable interim solutions and to develop relationships that set the stage for more far-reaching long-term efforts.

I see that too on the Colorado. On the Delta, not so much. That’s the key difference.


Stuff I wrote elsewhere: climate change and megafires

With the Whitewater-Baldy fire pushing 260,000 acres (New Mexico’s largest by a wide margin), I spent some time talking with the forest-climate community about climate change, forest health and the role of natural variability in creating the conditions for the southwest’s recent megafires:

Global warming is playing a role in the conditions in the Gila — “50-50 wouldn’t be a bad guess,” Betancourt told me last week — but the problem defies simplistic explanations. A big part of the warming is likely natural variability, driven by long-term natural ocean temperature patterns that influence continental weather, Betancourt said.

In addition to uncertainties in the climate attribution problem, Westerling pointed out that a century of human forest management has played a role in the recent fires, with grazing and fire suppression leading to woods choked with increasingly vulnerable fuel.

Sacramento Delta sinking faster than sea level is rising

The risk from sea level rise to California’s Sacramento-San Joaquin Delta system is frequently discussed. As sea level rises, the argument goes, the risk of failing levees increases. With a substantial share of California’s farmland and population depending on water supplies that flow through the delta, failed levees is an enormous risk. Levee failures, as the delta’s low-lying islands fill with water, would draw in sea water, saltying up the farm and municipal water systems that draw from the delta.

But a new paper from Benjamin Brooks of the University of Hawaii and colleagues adds a wrinkle. The land is sinking, Brooks argues, faster than sea level is rising. The team used space-based synthetic aperture radar (which goes by the name “InSAR”). This is not the well-known phenomenon of delta islands sinking as their peat soils is exposed to air and oxidizes:

Because the measurements are insensitive to subsidence associated with peat thickness variations over Delta-island length scales, it is most likely that InSAR rates reflect underlying Quaternary sedimentary column compaction.

This is the vast deposits of sediment below the peat layer, which built up since the end of the last ice age. Brooks et al. put the subsidence rate at 3 to 20 mm per year. The latest satellite estimates put global sea level rise at around 3 mm per year.

Inkstain Weather Central: a dry May

Let us stipulate that my home weather records are subject to what Tversky and Kahneman would likely call “the law of small numbers“. Which is to say that, when I tell you May is the driest month of the year around here, you should suspect my statistical reasoning. That said, it is factually correct to say that, in my backyard, over the 12 years I’ve been keeping data, May has been the driest month.

  • May – 0.22 inch (average 0.28)
  • water year to date (since Oct. 1) – 5.07 (average 4.58)


In Arizona, a Colorado River shortfall would hit ag first

What’s the Colorado River failure mode? By which I mean, with as much specificity as we can muster, when the water begins to run short, who will get less? I’m pushing this question because of a frustration with the doom scenarios generated by simply extrapolating the diverging supply and demand curves forward in time and invoking Anasazi/Hohokam portents of doom.

I’ve pointed a couple of times recently (here and here) to the risk faced by Arizona and Nevada. Juliet McKenna and her colleagues have usefully added to the discussion with a more detailed look at the pecking order within users of Arizona’s Central Arizona Project supply of Colorado River water:

M&I (municipal and industrial) subcontractors are in a relatively secure position for the next 25 years, while agricultural and other users of “excess” CAP water should continue to prepare for frequent, and perhaps sustained, reductions.

This gets to the critical question of how, in a very practical manner, shortage will spread through the basin. If there’s not enough water in the river to meet all needs, the “law of the river” will determine allocation among the various states. Each state will then be responsible for allocating shortage within its boundaries. McKenna’s analysis shows that ag holds the short straw in Arizona.

Science literacy, numeracy and science policy challenges

Dan Kahan, the Yale “cultural cognition” guy, has a new paper highlighting the problem with the argument that a more scientifically literate public will solve all our scientized problems, things like climate change, GMOs and nuclear stuff where the scientific argument has become intractably embedded in a political context.  (The paper’s actually targeted at climate change, but I think the argument extends to a much broader sphere.)

The paper’s in Nature Climate Change, and Dan’s done a nice summary on his blog:

We find that individuals who display high comprehension of science (i.e., those who score higher in science literacy and numeracy) are in fact more culturally polarized than those who display low science comprehension.

I’ve commented before on how these data relate to the popular surmise that seeming public ambivalence toward evidence on climate change reflects the predominance of what Kahneman (in his outstanding book Thinking: Fast & Slow, among other places) calls “system 1” reasoning (emotional, unconscious, error-prone) on the part of members of the public.

Our findings don’t fit that popular hypothesis. On the contrary, they show that individuals disposed to use system 2—conscious, reflective, deductive—reasoning (a disposition measured by the numeracy scale) are even more culturally divided than those disposed to use system 1.

This stuff is very much on my mind after participating in one of the most useful conference panel discussions I’ve ever done last week at the Tahoe Science Conference.

Tamara Wall from the Desert Research Institute invited me, and based on the initial discussions I assumed I would be playing my usual “science communicator” role. This is where scientists who’ve seen me successfully write about their work (or so they think) invite me in to explain how they can better get their point across to a sometimes recalcitrant public. I used to enthusiastically jump at these opportunities to explain how it’s done. These days I’ve adopted the glum “science communication is harder than you think”, “the deficit model doesn’t really work, and even if it did, I’m not gonna be able to fix the deficit”, etc.

But Wall was one step ahead of me. In addition to the climate scientist on the panel (David Pierce from Scripps, who ably explained how scientists approach the problem of attributing climate change to natural and anthropogenic causes), she invited two social scientists. Patricia Mynster at UNLV is doing field work on understanding and attitudes toward climate change among residents of rural northern Nevada. Kim Klockow at the University of Oklahoma is applying Kahan’s “cultural cognition” framework to people’s perceptions of weather and climate.

So when we were eating dinner the night before scheming about the panel, and Klockow brought up Kahan’s work, I’m thinking to myself, “Wait. You mean I’m not going to have to explain the science behind why my work is received in such varied ways?”

To say that I was happy is an understatement. I usually feel kinda lonely at these things.

On the Colorado, chance of surplus early, shortage down the road

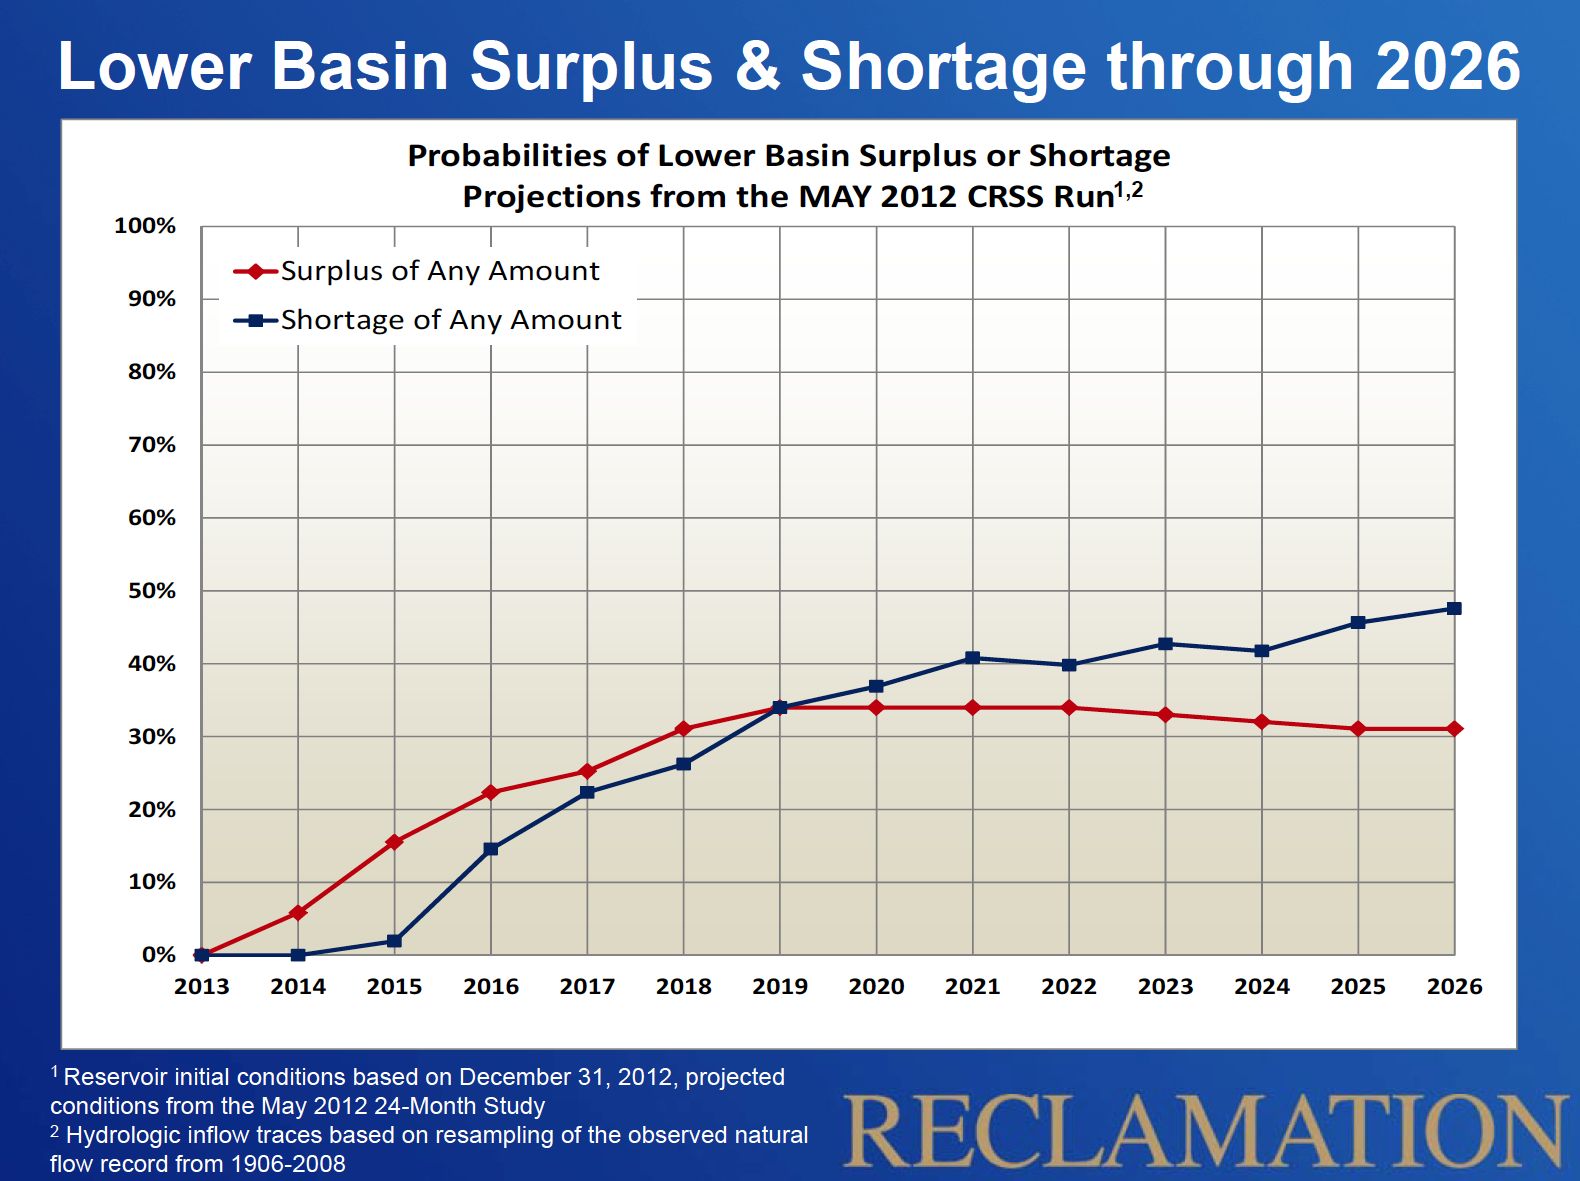
I know it is in the mission statement of all card-carrying western water journalists to harp on the gloomy prospects of shortage. But in the near term, the odds of a surplus on the Colorado River are greater than the chances of a shortage, according to new calculations by the US Bureau of Reclamation.

Don’t worry, though, I’ve still got a gloom card to play, as by 2019, the lines cross, and there is a nearly 50 percent chance of shortage by 2026.

The new calculations are based on the current forecast for storage in the big reservoirs of Lake Mead and Lake Powell at the end of this year, and use an ensemble of possible wet years and dry years, based on the 1906 – 2008 flow record.

Odds of Shortage and Surplus on the Lower Colorado

Odds of Shortage and Surplus on the Lower Colorado, courtesy US Bureau of Reclamation

We have to be careful to define exactly what we mean here by “shortage” and “surplus”. These are terms that are defined with Byzantine precision in the Colorado River Interim Guidelines for Lower Basin Shortages and the Coordinated Operations for Lake Powell and Lake Mead. A shortage occurs when Lake Mead’s surface elevation drops below 1,075 feet above sea level. As I’m writing this, it’s at 1,119.85, and it’s forecast to end the calendar year (the starting point for this calculation) at 1,118.26, per the latest monthly forecast (pdf). So another 33 feet until a “shortage” is declared, at which point Nevada (really Las Vegas) and Arizona see supply reductions.

Surplus is defined as Mead rising to about 1,145. We don’t talk about this as much, because we like to be all scary and drought-mongering, but as you can see from the graph there’s a greater chance of surplus than of shortage over the next few years. In a surplus condition, Arizona, Nevada and the Metropolitan Water District of Southern California all get bonus water. The last time Lake Mead had that much water was 2003.

The caveat – this calculation is the odds if past is prologue – that is, if the past range of variability over the previous century captures the variability we’re likely to see. To the extent climate change may be at play in the near term, you should adjust your thinking accordingly (push the shortage graph up a bit, and the surplus graph down a bit?).

The graph goes out to 2026 because that’s the “interim” in “Interim Guidelines”.

The Upper Basin doesn’t show up here because we Upper Basin users (I’m drinking Colorado River water here in Albuquerque as I write this) aren’t covered by this whole shortage/surplus scheme. We’re still not using our full share of the river’s water, so don’t worry about us, we’ll be fine.

Thanks to Carly Jerla and Paul Williams Miller at the Bureau for kindly sharing the graph, which Paul included last week in his presentation at the Tahoe Science Conference.

update: fixed error in Paul’s name – apologies to Paul for getting the name wrong, and thanks to an anonymous reader for pointing it out

Making a map

Inspired by the beautiful maps Geoff McGhee made for the Lane Center-KQED California Delta project, I spent some time this weekend playing with GIS software. I haven’t done any hackerly projects in ages, and a friend who’s a GIS professional had suggested QGIS, a free software project. (ArcGIS is pricey, and I’m a Mac guy at home.) The real driver here is a desire to use maps to better understand the subjects I’m writing about, and to better incorporate them into my published work.

OK, the real driver is I love to play with software? Whatever.

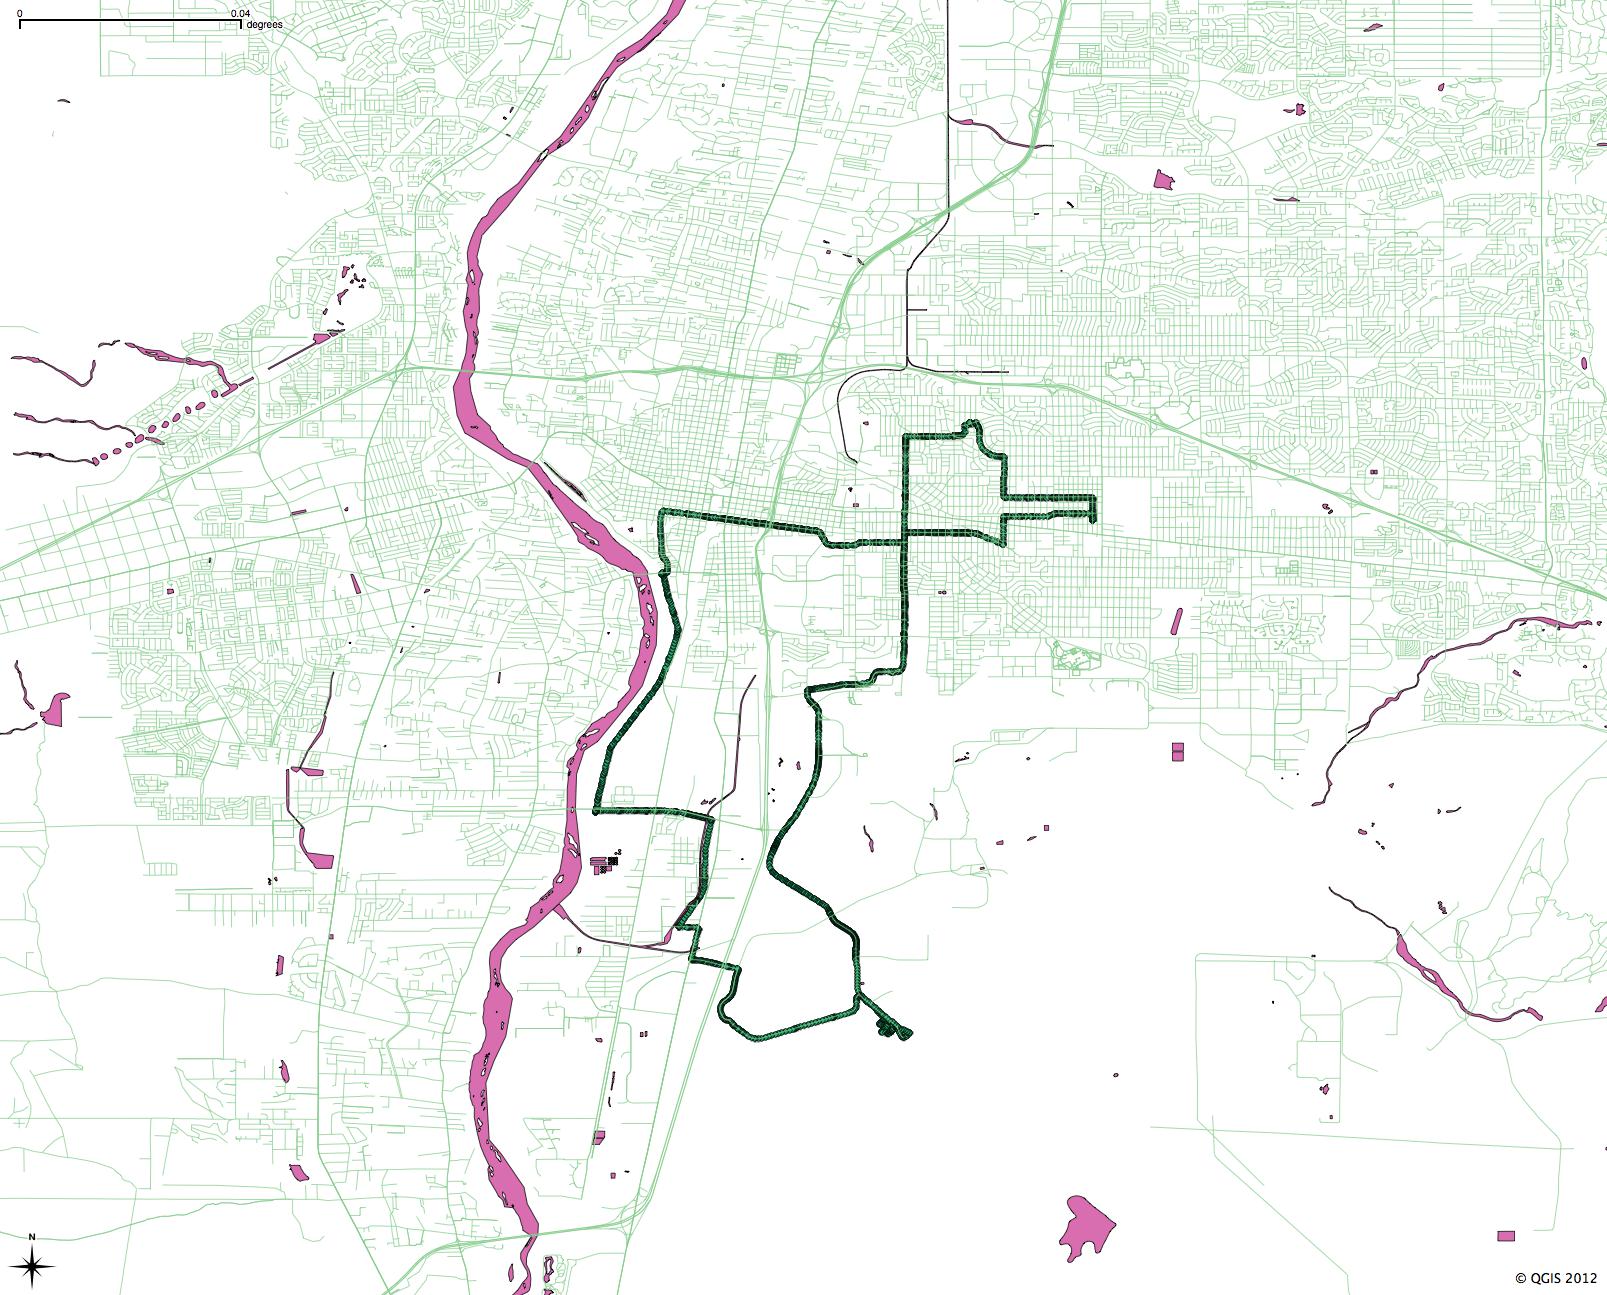
Herewith, one of my first maps, using Bernalillo County road and water base maps from Census TIGER files, plus the GPS trace from this morning’s bike ride:

bike ride, May 28, 2012

bike ride, May 28, 2012