As the national media descends on the tiny Texas community of Spicewood Beach to capture the spectacle of water trucked to a thirsty town, I thought it might be worthwhile to revisit the question of what we have learned so far from the impact of the Texas drought.
I tried to make a pie chart of the TCEQ data on water-short communities, but it proved unhelpful:
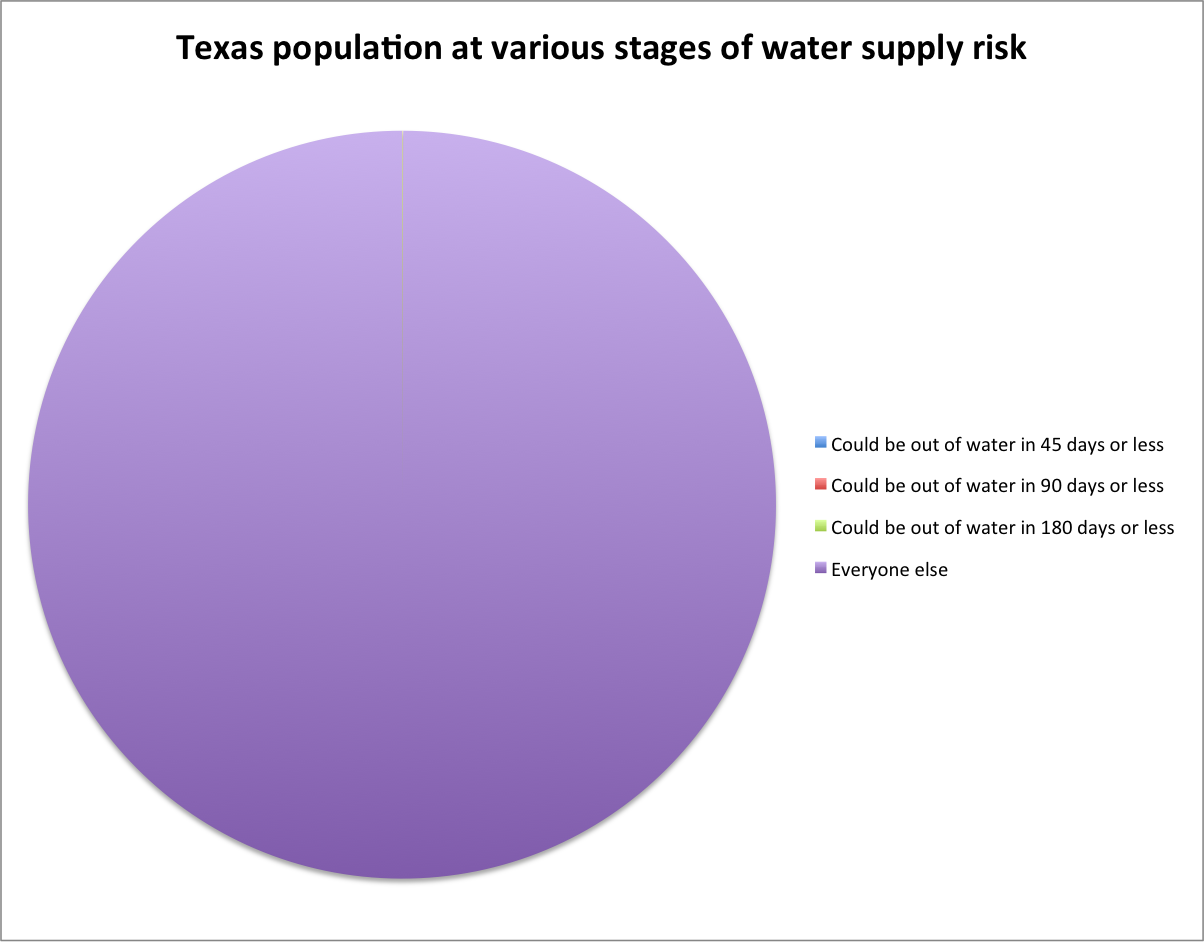
Texas population at various stages of drought risk
The difficulty here is that the software I’m using is incapable of making pie chart slices tiny enough to delineate the at-high-risk population from everyone else.
The folks in Spicewood Beach (population 1,296) and the other communities standing at the edge of the water supply cliff (2,871 who could be out of water in 45 days, another 3,162 if you extend that to 90 days, and another 7,441 if you extend that to 180 days) are in a heap of hurt, but most people in Texas (population 25,674,681) are not.
There’s no doubt that everyone else is in some level of hurt, but I’m struggling to think through how to conceptualize the effect of drought, if it is not running out of water. To be sure, there have been significant economic impacts, especially on the Texas agricultural economy. So I turned to the Philadelphia Fed’s state coincident economic index, which provides a nice single-number snapshot of the overall health of a state’s economy:
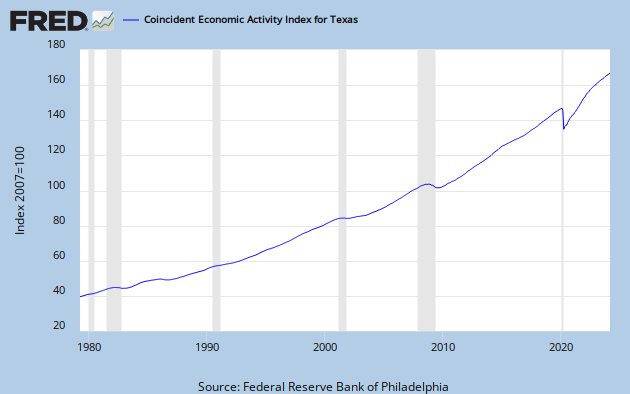
Texas state coincident economic index, graph courtesy St. Louis Fed
Whatever effect the drought has had in these terms seems to be lost in far larger economic forces.
For people like me who spend our time running around with our hair on fire trying to warn the public of America’s looming water shortages, Texas seems to me like an incredibly important case study about what happens when shortage finally arrives. So what’s it telling us?