Weird shit, well lit
Weird shit, well lit
For better or worse, my decision to not pay the $15 a day for an internet connection at Caeser’s Palace has left me with a bow wave of things to write about after a week spent in an around the Colorado River Water Users Association’s annual meeting in Las Vegas, NV.
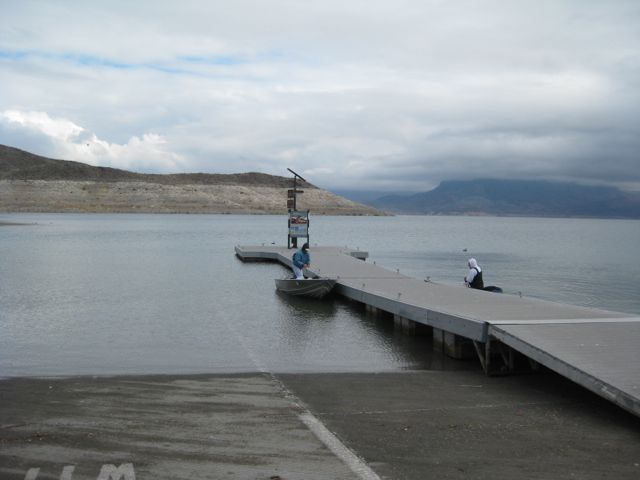
Boulder Harbor, 2011
Let’s start with Lake Mead itself, which hovers over Las Vegas like a reminder of trouble to come. But hey, the reservoir’s up this year, what’s not to like? Lissa and I drove the scenic road past the marinas on Mead’s western shore, the Las Vegas playground that was not so playground-y when I was there a year ago. At Boulder Harbor this year, I found a couple of guys fishing off the boat landing that a year ago was mired in mud. The striped bass were biting, and they looked big and tasty.
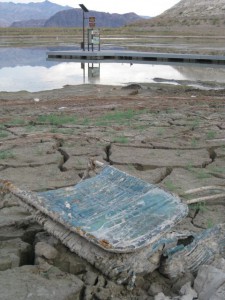
Boulder Harbor, 2010
Thanks to an epic snowpack, the reservoir is up more than 40 feet from where it was when I visited in October 2010 trying to document its drop to historic low levels. There were places where the shoreline was unrecognizable. But at the risk of sounding like a broken record, a close look at the data offers a reminder of the underlying problem. The Law of the River seems to ensure that the Lower Basin states are guaranteed 8.23 million acre feet a year of water released from Glen Canyon Dam. In the water year just completed, the US Bureau of Reclamation released 12.5 maf – 4.3 million acre feet of “bonus water” above and beyond what one might consider the system’s reliable yield. But Mead ended the water year up just 2.9 million acre feet. Some of the 2010-11 bonus water has already been used.
Consider the long term elevation of Lake Mead.
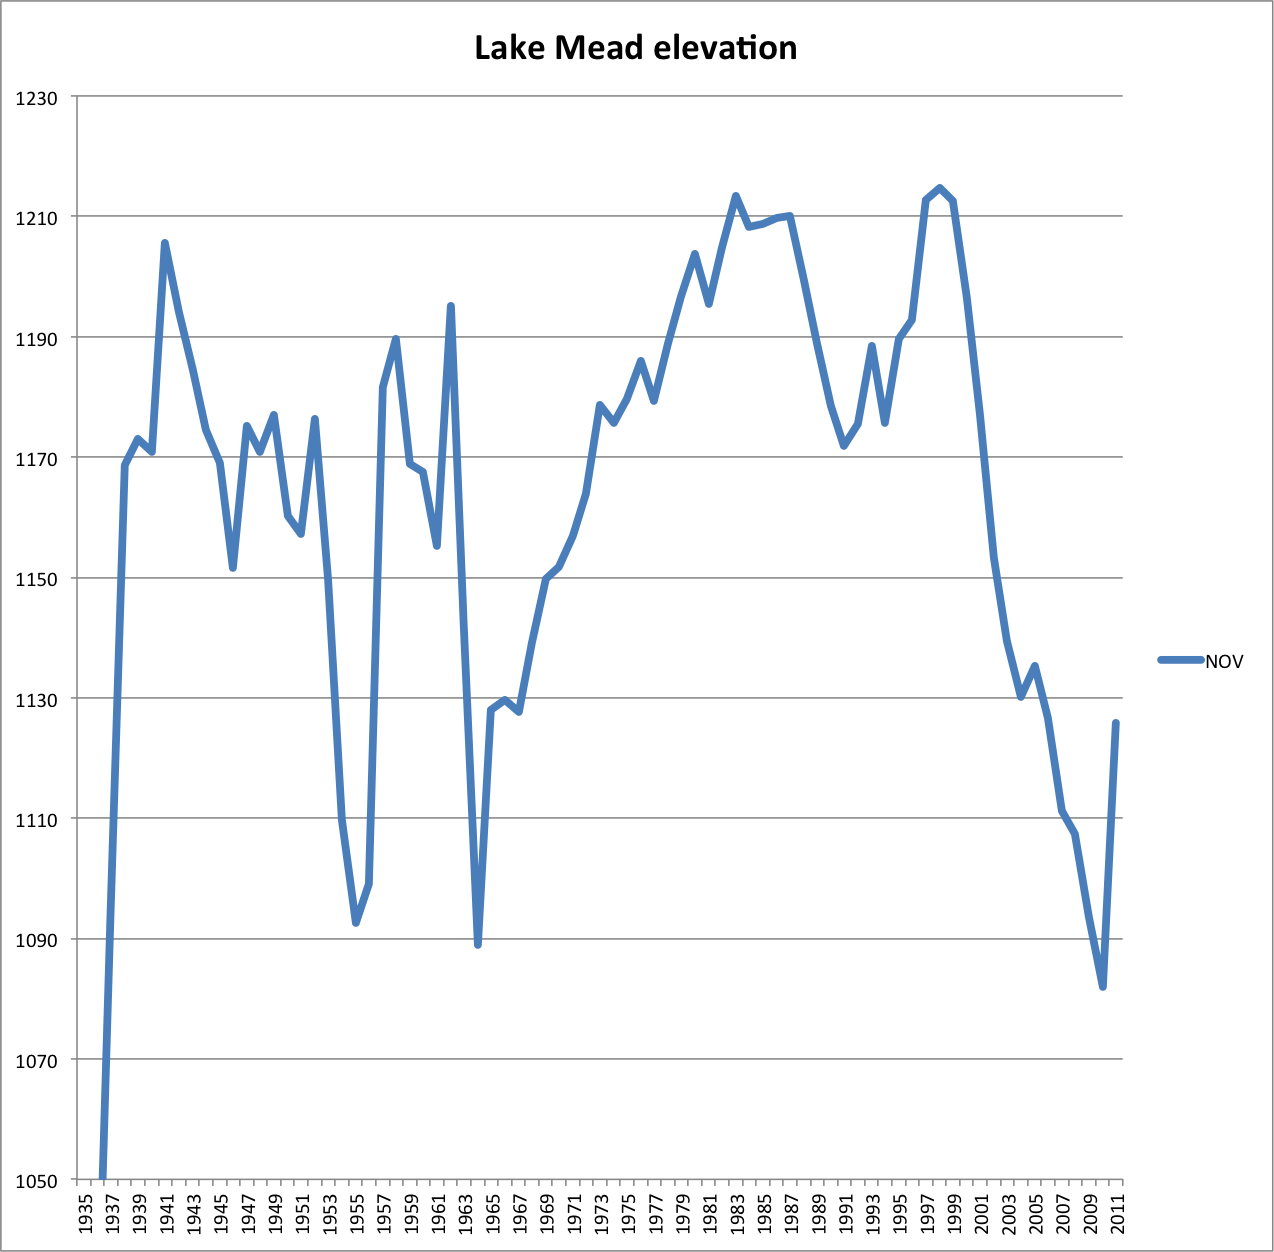
Lake Mead Elevation
The big long decline you see in the reservoir’s surface elevation, beginning in 2000, coincides with a period during with the full Law of the River release from Lake Mead, 8.23 maf, happened every single year. All it takes is three or four years of such minimally required releases – either because of drought in the Upper Basin, or because the Upper Basin states’ increasing consumption of water they’re legally entitled to but are not currently putting to use, to wipe out this year’s bounty.
In a sense, the Lower Basin’s drought is a situation of its own making.
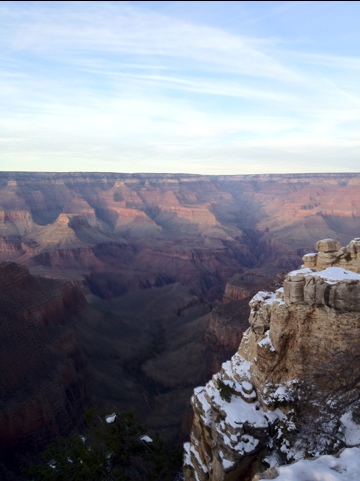
Standing at the Grand Canyon’s south rim this evening at sunset, I saw a woman walk up clutching her luggage, spellbound. “Oh my God,” she said. The look on her face said everything.
She was seeing it for the first time. She’d come to celebrate an “important birthday”, and said she wanted to spend it with something older than she was.
I’ve been here many times, and I still choke up at my first fresh glimpse of the canyon.
Thrown on driveways ’round town last week:
The New Mexico Court of Appeals has turned into the state’s chief water policy nag.
Three times in a little more than a year, most recently last week, the court issued rulings tinged with exasperation at the need to apply 20th century New Mexico water law to 21st century water problems.
“The review gives us pause to consider that there are substantial issues awaiting consideration with regard to future policies governing water,” the court’s most recent opinion explained in a plaintive footnote.
The court seems to suggest the Legislature needs to step in and noted that its ruling in the most recent case involving the Albuquerque’s use of river water left “these issues concerning future overall management of the Rio Grande Basin and its water resources … largely unresolved.”
Another example that the old New West development model isn’t working:
Next spring, water bills will rise to help pay the Southern Nevada Water Authority’s mounting debt used to fund some $3.3 billion in pumps, pipes and intakes installed over the past several years.
The fee, which comes on top of other recent increases, is needed because the old way of paying off water utility debt — connection fees paid by developers — has dried up in the recession. Consider that in fiscal year 2005-06, the Water Authority collected about $188 million in connection fees. This year, connection fees will total $11 million.
A graphical representation of what’s going on:
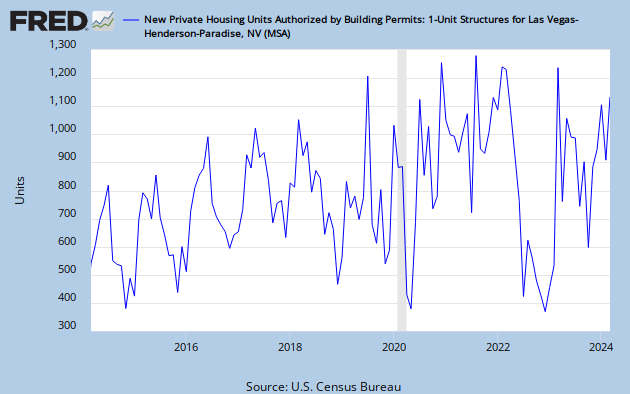
New home starts, monthly, Las Vegas MSA
Solving the Colorado River’s supply-demand imbalance is easy. There are lots of ways to do it.
OK, it’s a silly list. But the point is that in mathematical terms, there are a lot of different ways of balancing the books. All involve sacrifice and, as OtPR likes to point out in a similar discussion to our west, “This debate, over where the next century’s water should be allocated has genuine winners and losers.” But given that the water is finite and demand is outstripping supply, we will end up with some combination of the diverse list of options for closing the supply demand gap now being discussed in the Bureau of Reclamation’s Basin Study. There’s only so much water. To borrow Stein’s law, if something cannot go on forever, it will stop.
The real question for me is what the process of stopping will look like. As a journalist, I’m all about process. One clear path forward is litigation, but I get a clear sense from my conversations with Basin water types that no one wants to go that route because of the enormous downside risk. So the alternative is some sort of process aimed at determining, insofar as the current allocation rules are insufficient, who gets how much of the shrinking pie.
That’s why the new Carpe Diem West Governing Like a River Basin report was so interesting to me, and I hope everyone interested in Colorado River Basin issues reads it. It sketches out a number of different models by which other transboundary water issues are handled, from modest and loose to prescriptive and binding:
For each type, the report offers a case study of how it’s been used in North America. They’re worth a read. Some good ideas therein. It’s clear that something along the lines of what’s being discussed is needed.
But what remains, and is unanswered in the report, is the meta-process question. By what process involving the existing institutions we’ve got will some sort of solutions-oriented new process arise?
Dunno. Maybe we’ll end up in court. Or we could just abandon Phoenix. (I kid, and I have apparently written this post before.)
FYI, I’ll be at the Colorado River Water Users Association meeting in Las Vegas next week, if any of the water wonks out there will also be in attendance and wanna get together, maybe go throw rocks in the Bellagio Fountain or something?
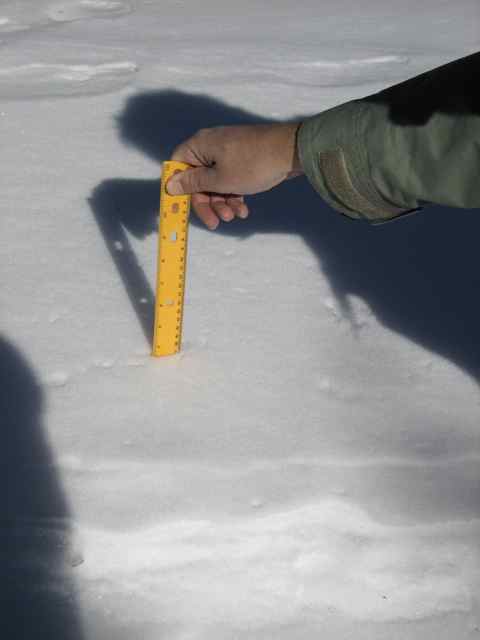
Measuring the snow
When I was thinking about how to write a book about climate science for kids, measuring the weather made sense to me. As a journalist, it’s my favorite science to write about because of the opportunities to tie science to everyday experience. And any kid can set up a thermometer and rain gauge in their backyard and do science for themselves.
That’s why I packed The Tree Rings’ Tale
Take your ruler with you outside. Look for places where the snow has fallen on a flat surface, like a picnic table or the top of a car. It should be away from buildings. Stick the ruler straight down through the snow. Note the height of the top of the snow on the ruler. Take three measurements, noting them in your journal.
I’m big on keeping a journal.
My fondest hope for this book is that somewhere this morning, kids who read it are out measuring.
Available through Amazon
Thanks to Controversy (the Journalist’s Best Friend), the subject of salinity in the Sacramento-San Joaquin-San Francisco Bay Delta system has received more attention of late than is usually attached to such arcane topics. But I did not realize how old this issue is.

courtesy Delta Stewardship Council
It was salinity and fish science that caused federal Judge Oliver Wanger to famously tee off on a pair of U.S. Fish and Wildlife Service scientists back in September. The underlying issue is that water removed from the Sacramento and San Joaquin systems that would otherwise have reached the estuary between fresh and salt water changes the system’s salinity. More fresh water flowing to the sea pushes salt water out of the system. Less allows the salt water to flow back in, through Suisun Bay and into the delta. This plays a role in the life history of the endangered delta smelt, which makes salinity a pertinent question in California’s tangled water management these days.
As Felicity Barringer explains it:
The area of ideal salinity for the smelt shifts back and forth, eastward and westward, depending on the time of year, the amount of rain and the decisions of federal and state water managers. (A fuller explanation with diagrams can be found at the Bay Delta Blog.)
This zone of ideal salinity for young smelt to feed is known as the X2; the Interior Department had decided that in wet years like this one, it should be no farther than 46 miles east of the Golden Gate Bridge. The decision was challenged in the lawsuit by the state and agricultural water interests, which prefer that less go out to the bay.
Pronouncements by two federal scientists on the issue drew Wanger’s ire, which made salinity the hot combat science topic of this past fall in California politics. But I was struck in reading Philip Garone’s environmental history of California’s Central Valley
The first irrigation diversions upstream of the delta date to 1852, and by the 1870s enough water was being taken out of the rivers to make a noticeable change in the delta. As rice farming expanded, the problems increased:
When a record 164,000 acres of rice cultivation coincided with a serious drought in 1920, the salinity problem in the Delta reached crisis proportions. In July of that year, the western Delta city of Antioc, situated near the mouth of the San Joaquin River, together with ninety-seven Delta landowners, brought suit against upstream irrigators in the Sacramento Valley. The plaintiffs requested that the irrigators be enjoined from diverting so much water from the Sacramento River and its tributaries that tidal salinity would advance far enough into the Delta to threaten Antioch’s municipal water supply, which was drawn from the San Joaquin River.
Antioch lost, the court ruling that it had no right to unsalted water if that meant someone upstream had to stop diverting. But efforts to deal with the issue in a long term fashion, Garone writes, eventually led to the creation of the Central Valley Project. Which is what led federal scientists back into court this year talking about salinity.
The folks working on the U.S. Bureau of Reclamation’s Colorado River Basin Water Supply and Demand Study last week published a striking new graph (figure 2 in this pdf) pointing out our dilemma:
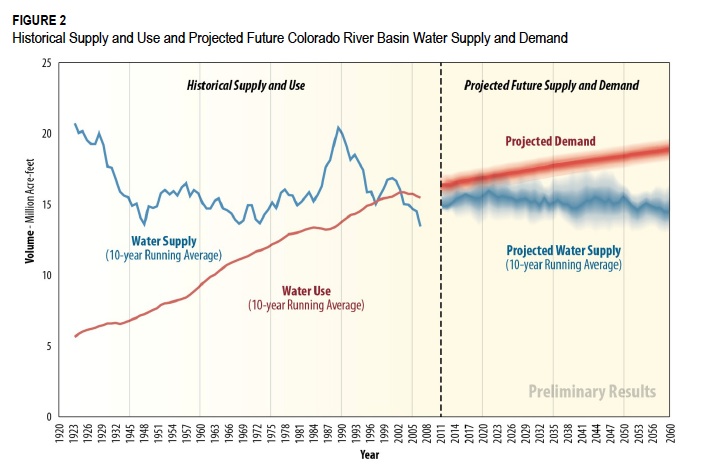
Colorado River supply and demand, historical and projected, courtesy USBR
It’s an attempt to splice together the latest version of the Bureau’s now-ubiquitous graph of historical supply and demand with the latest projections from the agency’s ongoing Supply and Demand Study. The crisp-looking bits to the left of the dotted line are what we know has already happened. Note the supply and demand curves converging in the late ’90s as Arizona finally starts using its share of Colorado River water. The fuzzy bits to the right of the dotted line, as the curves diverge, are the sternly caveated projections starting to squeeze out of the Supply and Demand Study.
In brief:
You’ll note that the demand numbers are larger than the supply numbers. If you have any suggestions re fixing this, the Bureau would like to hear from you.