Pielke Watch

update: Looks like William Connolley, whose qualifications to deal with this issue are above reproach, has done a nice update on the Roger Pielke Jr. WikiThing.
In a recent comment thread, I facetiously threatened to start a new Inkstian feature:

I think I’m gonna start a new “Pielke watch” feature on Inkstain, where I highlight people going all apoplectic about Roger. That guy’s like waving a red rag in front of you guys. :-)

My idea was to take Roger Pielke Jr.’s picture and PhotoShop a big target over his face. But after the whole Eli incident, I decided that’d be a bad idea.

I was kidding, but the whole BlogoFuror over Roger’s Wikipedia entry is such a classic example that I couldn’t resist. Someone – we’ll call him or her “24.99.142.88″ – thought that the most important thing worth ‘splainin’ about Roger’s work was that he was once invited to write a paper for the Cato Institute’s Regulation. There follows in the Wikipedia history an attempt to point out that he’s also written for liberal publications, and further edits to question the liberalness of the alleged liberal publications, with the result that Wikipedia readers are left with an absolutely vapid entry solely devoted to dueling tribal labels but no discussion of what the guy actually thinks!

And then Roger blogged about it. Which was really waving a red flag in front of David Roberts, whose Pielke Pathology is up there with the best of ’em, and whose “journalistic” analysis of Roger’s views (not unlike “24.99.142.88”) seems to consist largely of an ad hominem critique. And then Steve Bloom, who is worse than any of them when it comes to Pielke Pathology (see the above-referenced comment thread), joins the party!

All that’s left is for Eli Rabbett to chime in, and we’ll have the full Pielke Pathology trifecta. Eli?

Water in the Desert


Water in the Desert

Originally uploaded by heinemanfleck.

Mountainair, New Mexico, is not technically a desert. It averages nearly 15 inches (~40 cm) of precipitation a year. Nearly half of that falls in the summer rainy season, from late June into September, in big rapid thunderstorms.

With essentially no surface water for miles around, the ranchers dig stock tanks like this, carving out a depression along a drainage and piling up the dirt they remove into a berm that serves as a dam to hold back runoff for the cattle to drink. We saw this one on a drive Friday with Mom and Dad between Mountainair and Gran Quivira.

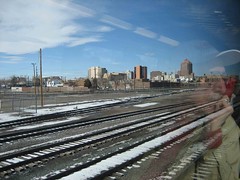
Albuquerque from the Train


dad_train_4

Originally uploaded by heinemanfleck.

It is very likely that this is the first view my Dad ever had of Albuquerque, riding the train across American more than three score years ago, a Pennsylvania boy on his way to California for the first time. I didn’t mean to get his reflection in the picture. In fact, I didn’t even notice it until I was downloading ’em just now. When I took it, I was thinking, “This is the first view lots of people have had of Albuquerque, coming in on the train.”

It didn’t occur to me at the time that Dad was one of them.

More snaps from the trip.

Mapping Soil Moisture Anomalies

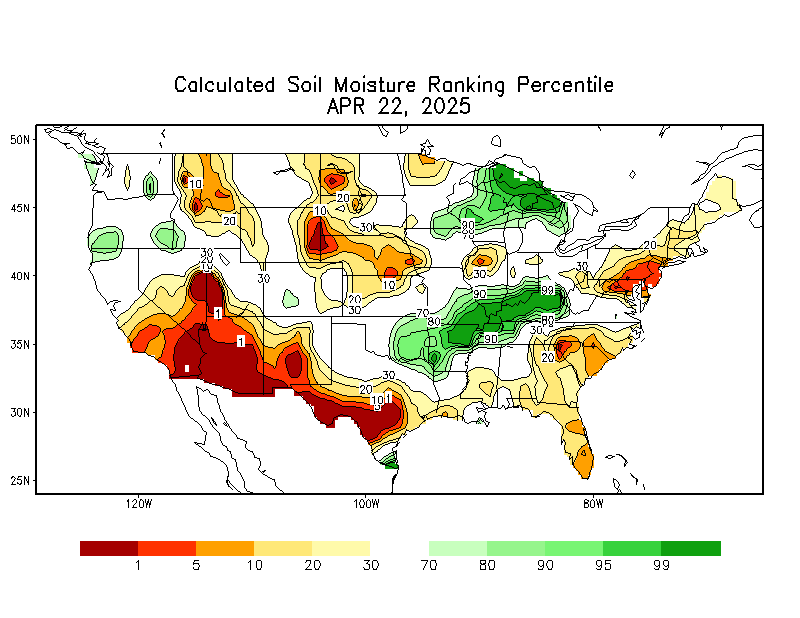
NOAA soil moisture map

One useful measure of drought/pluvial conditions is soil moisture, which is critical both for non-irrigated farming and natural ecosystems. Today’s map is from NOAA’s Climate Prediction Center, which publishes a host of map products intended to illustrate what’s going on.

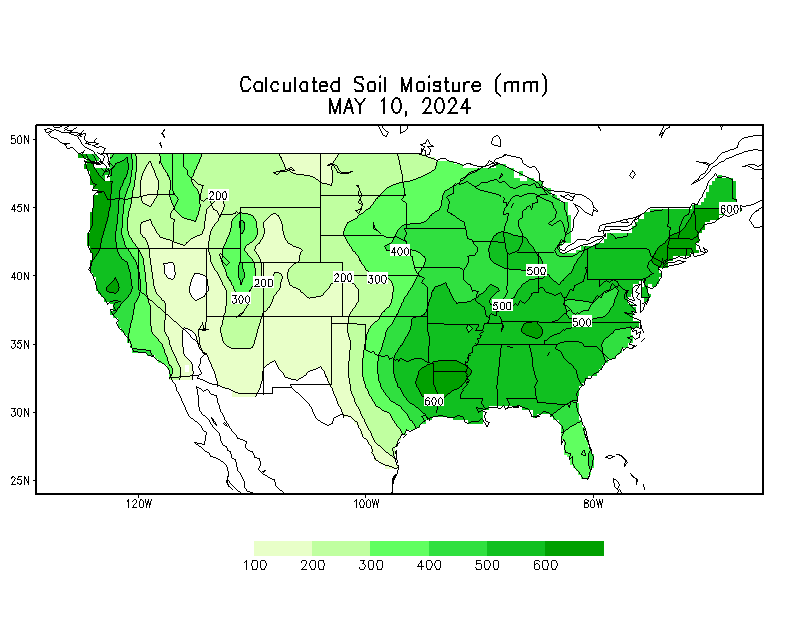
Note that the map I’ve chosen does not represent absolute soil moisture, which is available but is not terribly useful. Farms and ecosystems are adapted to “normal” conditions and the normal range of variability in their particular location, so what matters is not the absolute moisture but the extent to which current conditions depart from the norm.

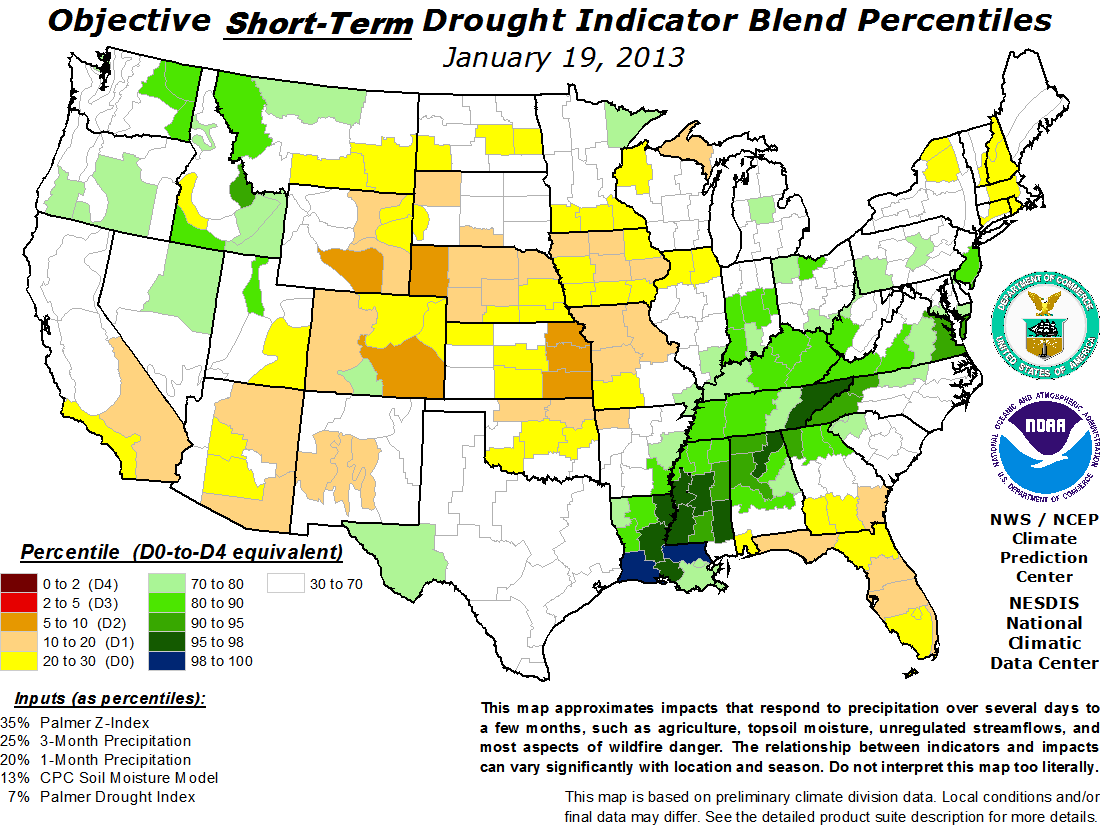
Soil moisture corresponds with short-term conditions, and you can see a lot of similarity between the map above and the drought monitoring folks’ short term blend. Here in New Mexico, you can see the green splotches (color choice in the map is obvious and useful) indicating the relatively wet winter we’ve been having.
What soil moisture misses is the long term hydrologic conditions. That’s why the green splotches on New Mexico can be deceptive. While a great deal of our agriculture is dryland, soil moisture dependent, much of the ag in the central part of the state, along the Rio Grande, depends on snow-fed irrigation, and even multi-year snow pack conditions because of reservoir storage. That’s why conditions in New Mexico, while definitely improving, are not as good as it seems when I go out in the back yard and poke my finger into the dirt.

Another Hockey Stick

We haven’t done hockey sticks here in a while, but there’s a paper in the new Journal of Climate worth noting in this regard:

High variability in reconstructions does not hamper the detection of greenhouse gas–induced climate change, since a substantial fraction of the variance in these reconstructions from the beginning of the analysis in the late thirteenth century to the end of the records can be attributed to external forcing. Results from a detection and attribution analysis show that greenhouse warming is detectable in all analyzed high-variance reconstructions (with the possible exception of one ending in 1925), and that about a third of the warming in the first half of the twentieth century can be attributed to anthropogenic greenhouse gas emissions. The estimated magnitude of the anthropogenic signal is consistent with most of the warming in the second half of the twentieth century being anthropogenic.

Detection of Human Influence on a New, Validated 1500-Year Temperature Reconstruction, Hegerl et al., Journal of Climate. Vol. 20, No. 4, February 2007, DOI: 10.1175/JCLI4011.1

More Stuff I Wrote Elsewhere

My first serious exposure to Roger Pielke Jr.’s work was at an American Meteorological Society meeting in Albuquerque in 2001. He gave a talk laying out the basic thrust of his hurricane vulnerability argument: that societal changes (essentially building stuff on the beach) are the dominant variable in the societal hurricane risk equation. It’s an argument he and Dan Sarewitz lay out here.

I’ve long thought the argument also applies to climate change and drought in the southwest. So I took advantage of their Nature paper to sketch out the issue in the weekend Albuquerque Journal:

New Mexico’s population is projected to increase 33 percent by 2030— an extra 650,000 people, all needing water to work and live.

In addition, scientists say that even if we slash greenhouse gas emissions now, Earth’s climate will keep changing for decades as it catches up to what we have already put into the air.

“No matter what greenhouse gas reduction policies the world agrees to, those policies will not have an effect on the climate for decades,” Pielke said.

That means residents of the West must focus as much on how we use our water as on what we put out our tailpipes, Pielke said in an interview.

Stuff I Wrote Elsewhere

On paleoclimate in caves:

In most parts of the world, New Mexico included, there have only been rain gauges and thermometers to record the weather for a little more than a century.

To figure out what happened before, scientists are exploiting a growing arsenal of tricks, from layers of ice in Antarctica to corals that grow differently depending on whether the water around them is warm or cold.

In New Mexico, tree rings have long been scientists’ tool of choice. But tree ring records here only go back 2,000 years. Asmerom has turned to cave formations to push the climate record back in time.

The idea is that changing rainfall patterns on the mountains above Pink Panther Cave are reflected in the growth patterns of the cave’s stalagmites. Asmeron and his colleagues painstakingly analyze the stalagmite’s layers in a University of New Mexico lab to tease out the story.