Grand Ditch

KAWUNEECHE VALLEY – The Colorado River was flowing this morning at around 700 cubic feet per second at the USGS gauge near Baker Gulch. It felt like a lot of water – spilling the channel banks and out into the meadows, as is its way in a good spring runoff.

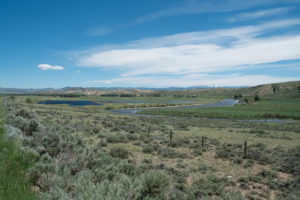
Rocky Mountain National Park near the headwaters of the Colorado River. The scar on the hillside is the Grand Ditch.

If you look downstream at the Colorad0 by the time the river passes Glenwood Springs, the contribution of the little tributary through the Kawuneeche Valley seems tiny – around 5 percent of the 14,000-plus cfs right now at the Glenwood gauge. But by virtue of geographical naming conventions, the “little tributary through the Kawuneeche Valley” is named “the Colorado River”, so that’s where I came to make a headwaters pilgrimage.

I’m between Colorado meetings. Thursday and Friday was the Martz Conference at the University of Colorado School of Law, a gathering of the Colorado River brain trust I try to attend every year. Next week the University Council on Water Resources is converging on Fort Collins. For the few days between, I’ve fled across the continental divide to Colorado’s West Slope to get some work done, and to do my favorite thing – wander around looking at water stuff.

One of the hardest things about mastering the nuances of Colorado River Basin water policy and politics is the nuance of intra-state conflict. I mostly work at the basin scale, where it’s easy to fall into the trap of viewing each state as a monolith, as a single blob of shared interest. At best they behave that way when it comes to working in the basin-scale governance process, but back home it’s always more complex.

Here in Colorado, the important nuance is the West Slope-Front Range tension over trans-mountain diversions – moving water from the west side of the continental divide to the east. The “Grand Ditch” (so named because the Colorado was then named the Grand River here) is one of the earliest large such diversions, built in the 1890s to take water from what is now the Never Summer Mountains and deliver it by gravity flow across La Poudre Pass for farmers on Colorado’s east side.

That gash across the mountainside in the picture above is the Grand Ditch.

courtesy Northern Water

With all due respect to my friends at Northern Water, the plumbing up here is absolutely crazy.

The Colorado here flows into Grand Lake, which they expanded with the construction of Shadow Mountain Dam. They drilled a tunnel out of the bottom of Grand Lake, under Rocky Mountain National Park and the continental divide, to deliver water to Northern’s system.

But wait. There’s more. Just downstream of Shadow Mountain is Lake Granby, created by the construction in the 1940s of Granby Dam. Grand/Shadow Mountain don’t have a lot of storage, so they built Granby to add to the system’s storage capacity. But Granby is downstream of Grand Lake and the tunnel. So water is pumped back upstream when it’s needed.

But wait. There’s more. Downstream from that is Windy Gap Reservoir. Which expands the storage a bit more. When it’s needed, Windy Gap’s water is pumped back uphill to Granby. But if Granby is full? See Windy Gap Firming Project.

But wait. There’s more. Green Mountain Reservoir is my favorite piece of this crazy system, because it illustrates the complex institutional tensions that arose when folks on the east side of continental divide began increasing their trans-mountain diversions. Green Mountain is a sort of compensation for lost water. It provides storage of early runoff to keep Colorado River flows above Kremmling higher during the summer months when the river would otherwise drop because of the diversions from all the plumbing upstream. Added storage for West Slope use was part of the grand compromise for the trans-mountain diversions folks east of the continental divide wanted.

Click on the embedded map for a link to a high-res pdf of the rest of the system, courtesy of Northern Water. Because yes, there’s more.

All of this storage and tunneling and pumping is based on the idea that during the peak of spring and summer runoff, there’s lots of water. Stored and then moved to other places, it provides benefits. But it also is worth noting that were it not stored, pumped, tunneled, diverted, it would flow downstream where both human users and natural systems (“rivers”) await. Hence the importance of understanding the nuances.

The argument in Colorado has always been between those who viewed the economic potential and therefore the value of the water as being far greater along the Fort Collins to Pueblo “Front Range” corridor, versus folks on the west side who so keeping that water as central to their communities’ future. On the West Slope water is, to borrow from the historian Steven Schulte, “as precious as blood“.


the Colorado River

As climate warms, a decline in snowmelt runoff

Based on hydrological model simulations and a new snowmelt tracking algorithm, we show that 53% of the total runoff in the western United States originates as snowmelt, despite only 37% of the precipitation falling as snow. In mountainous areas, snowmelt is responsible for 70% of the total runoff. By 2100, the contribution of snowmelt to runoff will decrease by one-third for the western U.S. in the IPCC RCP8.5 scenario. Snowmelt-derived runoff currently makes up two-thirds of the inflow to the region’s major reservoirs. We argue that substantial impacts on water supply are likely in a warmer climate.

Li, D., M. L. Wrzesien, M. Durand, J. Adam, and D. P. Lettenmaier (2017), How much runoff originates as snow in the western United States, and how will that change in the future?, Geophys. Res. Lett., 44, doi:10.1002/2017GL073551.

Albuquerque, y’all

A Sunday morning on Albuquerque’s Rio Grande

People, this is right in the middle of my town. Right in the middle.

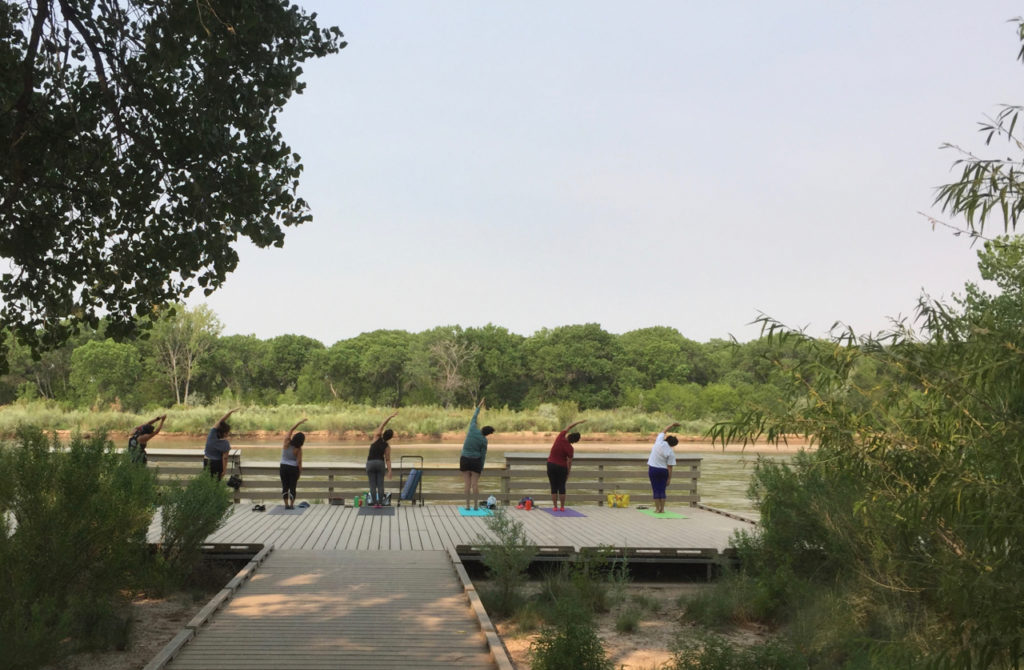
New riding and walking trail along the Rio Grande in Albuquerque

This is about half a mile from where I took the last picture, up a new riding and walking trail just north of the old Route 66 bridge right in the middle of Albuquerque.

Near the Rio Grande Nature Center, Albuquerque

The river’s up this year, it was a great day to wander Albuquerque’s riverside. I mean, this is right in the middle of Albuquerque.

Desalination and water’s scale issue

A sometimes poorly understood piece of the water story is the question of scale – the truly enormous quantities of water required to do human stuff like be a city or grow our food.

This is the shortcoming of well-meaning suggestions like building a pipeline to the Missouri River or a string of desalination plants along the coast, or a string of desal plants that connect up with big pipelines criss-crossing the country.

Writing in the San Jose Mercury-News last week, Stanford’s Leon Szeptycki and Newsha Ajami gave a nice explanation of the problem in the context of California’s ever-present desal discussion:

We withdraw approximately 42 million acre-feet per year from rivers, streams, and aquifers in California. We use up a net total of 33 million acre-feet of that. According to the 2013 update to the state’s water plan, even if every proposed ocean desalination facility were built (an unlikely scenario), they would produce a combined total of approximately 382 thousand acre-feet a year, less than 1 percent of the state’s existing water budget.

This doesn’t mean that desal does not have a place at the margins, in niches where there is no good alternative. But in general the scale of our water use is far too vast to have any impact on the overall problem.

#tbt – Dorothea Lange in the dry lands of eastern Oregon

“New farm in Cow Hollow, Malheur County, Oregon. Note basement dugout house and excavation for new house in foreground.” Dorothea Lange, 1939, courtesy Library of Congress

Some day I’m going to find an excuse to write – I mean really write – about Dorothea Lange.

One of my favorite Internet rabbit holes is the Library of Congress photo archives, and one of my favorite sub-rabbit holes there is the work of Dorothea Lange.

For much of the 1930s Lange, working for the Resettlement Administration and then the Farm Service Administration, photographed rural American poverty. Much of our common public understanding of the depression and its impacts on rural America (they also shot urban poverty, but their most powerful work was of rural communities) comes from the iconic imagery of Lange and her FSA colleagues. Lange’s “Migrant Mother” is one of the great works of the American canon.

There’s something deeply uncomfortable about the work for a couple of reasons. The first is the raw intimacy with which Lange shows poverty. Some of them make me wince. You’ll notice my choice of picture for this post – not one of Lange’s burning close-ups.

The second is the way in which our government funded the creation of the imagery, which it made freely available, as part of an effort to build public support for policies that were in  some ways controversial. Lange and her FSA colleagues were not traveling randomly. They were visiting places served by FSA and other federal programs. The picture above if from a Lange trip documenting the US Bureau of Reclamation’s Owyhee Project, delivering Snake River water to farms in eastern Oregon. There is a huge body of FSA work documenting the benefits of federal irrigation as the Resettlement Administration and subsequent federal programs attempting to develop new agricultural communities for those driven out of the Midwest by the Dust Bowl. Side by side with their more famous and powerful work are many FSA pictures of irrigation works. Dorothea Lange was at her best photographing people. Her plumbing work – meh. I am uncomfortable with the implication that this amazing body of American art was funded by and used as tool of government propaganda.

Both of those reasons for discomfort interest me enormously. Because the pictures are amazing, a remarkable body of work capturing a remarkable moment in time.

“Franklin Schroeder, from South Dakota, and his two older boys. Dead Ox Flat, Malheur County, Oregon.” – Dorothea Lange, 1939, Courtesy Library of Congress


Imperial Irrigation District is saving a lot of water

There’s something that really jumps out in the Bureau of Reclamation’s final accounting of 2016 Lower Colorado River Basin water use.

In May, the Bureau releases the official accounting, which is a meticulous, tedious, closely watched and monitored and argued over report on who used how much water on the Lower Colorado. Much to digest in the report, and I haven’t ground through the full details yet, but this caught my eye.

The Imperial Irrigation District, the largest water user on the Colorado River, saved 513,573 acre feet in 2016 through a variety of conservation programs. That is more than two Las Vegas’s consumptive use. That is more than ten Albuquerques.

Crops and a canal, Imperial Valley, March 2014, by John Fleck

Some of this involves longstanding conservation efforts done in collaboration with other California water agencies, some is more recent. Some involves fallowing fields to conserve water, some system efficiencies, some canal lining. Here’s the tally, from a presentation last week to the IID board by district water manager Tina Shields:

  • IIM/MWD system efficiency agreement: 105,000 af
  • All-American Canal Lining: 67,700 af
  • Fallowing: 152,641 af
  • Main canal seepage interception: 35,393 af
  • Interties between canals, allowing more efficient water movement: 3,603 af
  • 12-hour deliveries (amazing the water saved by delivering water in more precisely timed blocks!) 11,651 af
  • on-farm efficiency 138,585 af

That adds up to a 20 percent decrease in water consumption since 2003 on the part of the largest user on the Colorado River. That’s a lot of water. We don’t have the 2016 ag production numbers yet, but in general what we’ve seen during that period is an increasing trend in agricultural productivity. In 2015, inflation-adjusted farm income was up 26 percent from 2003. As I wrote in my book, as water becomes more scarce, farmers have been shifting land out of low-dollar crops like alfalfa and into high-dollar crops like lettuce and other vegetables.

Less water, more agricultural productivity. Important lessons here.

Why you should be reading Brett Walton’s “Federal Water Tap”

Did you know that there are 16 separate federal “activities and programs” with some sort of jurisdiction over and responsibility for rural water? 18 for drought mitigation and response?

I did not. I mean, I had a general idea, but not in the sort of excruciating and incredibly useful detail as you can find in this Congressional Research Service report. I’ll be handing this out to students in the UNM Water Resources Program, it’s invaluable.

I know about it thanks to Brett Walton’s weekly Circle of Blue Federal Water Tap, an invaluable aid in my efforts to track US water policy. Every Monday (Tuesday this week because of the holiday). Subscribe here.

Water rights adjudication, Utah style

Here in New Mexico, in the relatively populous Middle Rio Grande Valley, we have no expectation that water rights – the legal question of who is entitled to the use of how much water – will ever be clearly determined, at least not in the lifetimes of anyone involved in water management today. The institutional transaction costs – the time and money and resources required to sort out the water rights – are prohibitive as our law is now structured. Far small adjudications – fewer water rights holders, less water – have taken more than half a century in New Mexico.

One school of thought holds that this lack of clarity cripples our ability to manage water. The other school of thought (toward which I lean) holds that we’ve muddled through to date, and that we’ll continue to do so with ad hoc management tools that route around this problem.

In Utah, they’ve decided to throw state resources at their version of this problem, according to this Salt Lake Tribune piece by Emma Penrod:

For some river systems, such as the Virgin and Weber rivers, adjudication is done. But the Utah Lake/Jordan River system covering heavily populated Utah and Salt Lake counties remains largely untouched. That watershed, he said, likely has more water rights tied to it than any other in Utah.

Because of its population, Bingham said water rights in Salt Lake County have been unaddressed since the 1980s, when the division last opened a new area in the county for adjudication. Back then, a lack of cash led Bingham to predict it would take another 100-150 years to fully document water rights statewide.

But the 2017 Utah Legislature set aside nearly $1.9 million in sales tax money to help sort through water rights, leading officials to refocus efforts on Salt Lake County. The Division of Water Rights now hopes to triple or quadruple its staff and have Utah’s most populous county adjudicated in 10-15 years.

River management in the anthropocene

“A lively debate, provocatively labeled ‘conservation in the Anthropocene,’,” my University of New Mexico colleague Ben Jones and collaborators wrote last year,  “has been taking place over what conservation, and related notions of naturalness and preservation, means where large natural systems are increasingly inter-connected or coupled to human systems.” In particular, Jones et al. were interested in the Colorado River and Glen Canyon Dam, and the proper incorporation of the range of communities and values that must be incorporated in decision making regarding the dam and its relationship to the larger “coupled human and natural system.”

Ben is (and I am) using the word “anthropocene” here not in the formal geological sense – a grand debate over where we’ve entered a new “-cene” defined by an identifiable geologic layer of human stuff. Rather we’re using it in the broader sense in which it has migrated into public discourse, the way David Biello was using it in a book review essay in today’s New York Times:

The waterways of the West now exist as monuments to an ambitious desert civilization. Across this vast region of America, few, if any, rivers flow without hosting one or more dams, concrete channels, diversions or other human-made “improvements” that allow people and farming to flourish in this dry country. And few, if any, rivers reveal this unnatural world more than the Colorado, which no longer reaches the sea or carries along its entire 1,450-mile length much of the reddish silt that inspired its name.

Downstream from Glen Canyon Dam, the Colorado River is green not the red of its name. Navajo Bridge, May 2017, photo by John Fleck

When I was deep into work on my book, a friend over beer was quizzing me about where I in was in the project, what I was writing about. The friend, a law professor, was doing what law professors do I guess, that sort of Socratic questioning that ultimately led me to the realization that while I said I was writing a book about the Colorado River, what I was really writing was a book about what happens with the water once we take it out of the Colorado River. It was a striking realization, with which I ultimately made peace, and it was an important insight both for the book and for how I think about the river and my work going forward.

Biello’s NYT piece, a review of David Owens Where the Water Goes, goes full Anthropocene on this point:

The people of the Western states, in collusion with the federal government, have opted for irrigation, power and sprawling cities in the desert like Los Angeles and Phoenix. The glass of Colorado River water is either half-full or half-empty, depending on whether you think water woes bring out the cooperative side of people, or the litigious. As Owen discovers on his journey, both are true — lawyers and legislators make a good living adjudicating claims, but owners of water rights also often work it out among themselves without drying anybody out. This is a system that muddles through on a blend of threats and collaboration, with the underlying understanding that everybody must win or everyone will lose, as the longtime water reporter John Fleck explores in his illuminating recent book “Water Is for Fighting Over.” It remains to be seen what the likely shortfall of rain and snow brought by global warming will do to this already fraught series of arrangements.

The river here is defined now by our decisions to take water out of it, and by the “fraught series of arrangements” with which we try to manage the problems that are upon us now that the Colorado seems to be running short. It is simply impossible to think of the Colorado absent those fraught arrangements and the implications for the “irrigation, power and sprawling cities in the desert like Los Angeles and Phoenix”. It is in fact a coupled human and natural system, deeply coupled.

In the distance, Lake Mead, where we spread our water out to dry in the desert sun

This is the painful realization at the heart of Frederick Reimers’ piece last week in Outside Magazine about the dreamers who would drain Lake Powell and free Glen Canyon. “Fill Mead First”, the dreamers’ scheme, would move Powell’s water downstream to Lake Mead, emptying Glen Canyon Dam. It’s premise is classically Anthropocene – that because of Powell’s seepage and evaporation losses, you could save water for human use and free up Glen Canyon as a happy side benefit. As I’ve written before, the best science suggests that those savings are not to be had. But there’s also something wonderfully Anthropocene about the whole argument, as Reimers writes:

Without Powell, more dams could be greenlighted upstream to replace that storage capacity, meaning free-flowing sections of rivers that feed the Colorado—including the Gunnison, Yampa, and Green—could be compromised. Water diversions could be built, too, pulling enough water from the river that it might not even flow in some stretches.

It’s a coupled system now. There’s no uncoupling.

In the end Biello’s NYT piece, and Owen’s book, and mine, all point to a narrow but hopeful path. All three of us point to Minute 319, the US-Mexico agreement that returned water, however briefly, to the Colorado River Delta, left dry by all of that water we take out to use elsewhere. Here’s Biello:

Part of the work of the next few decades is to imagine and build a better future rather than letting inertia reign.

Perhaps that better future allows the Colorado River to flow along its entire course, restoring a once lush wetland teeming with life while also allowing for all the human uses along its length. That delta has been dead for more years than I’ve been alive, killed by the filling of Lake Powell, which means everyone born after 1963 accepts this as the normal state of affairs. But there is no reason I or my children couldn’t see Lake Powell and the delta. Our hand is on the faucet of a formerly natural, unpredictable waterway; what will we do with that power and responsibility?

This is a fundamentally different narrative than the old stories of Cadillac Desert and A River No More, stories of humanity’s sins against nature and our coming punishment. It’s a narrative I’m happy to be a part of.

Lots and lots of people seem to be going to our National Parks

Virgin River, Zion National Park

Driving back this week the long way from Las Vegas, Lissa and I were stunned by Zion National Park. The river was high, the rocks were red, and the people were everywhere.

I’m guessing it’s been 50 years since my first Zion camping trip, with Mom and Dad and Lisa and one of those big canvas tents. I’ve been back many times since, but not for 15 or 20 years. Lissa and I stayed in St. George and drove up for the day. Mindful of the Park Service warnings, we parked outside the park, in the little town of Springdale, and rode the shuttle bus to the park entrance.

Zion is magnificent, beautiful narrow canyons carved by the Virgin River and its tributaries from the geologic layer cake of the Colorado Plateau. You can see why lots of people would want to come here, and I am not one to complain about the crowds. I go to cities for fun all the time, where there are lots of people. But when I turned to the visitation data on our return to St. George, I was frankly stunned.

Source: National Park Service, graphed by me

If you believe the data from the Park Service’s visitor use database, visitation to Zion has risen 52 percent in the last three years, topping 4 million people in 2016. That’s a huge step  function beginning in 2014, almost too big a jump to be believed.

Zion is not alone, according to the Park Service data. Joshua Tree, Canyonlands, Rocky Mountain National Park all saw increases of more than 50 percent. I only poked around randomly looking at parks that interested me, so my look at this data is in no way comprehensive, but here’s a graph of all the parks I pulled the data for. I apologize for the clutter, Prof. Fleck would grade his students off for posting a graph this busy, but look at all those hockey sticks!

Park Service visitation

Here’s another attempt at a visualization, a tiny multiples graph showing each of the parks I looked at from 2000 to the present, without vertical scale and a non-zero baseline, just to get a feel for the shape of the curve for each park. You can see that every park save Lake Mead (a National Recreation Area, not a “park”) has a jump beginning in 2014.

I posted some of the graphs on Twitter and mused about what might explain it, and my friends pitched in with a host of hypotheses:

  • a change in data collection or reporting methodology – maybe they’re counting differently?
  • a surge in foreign visitors (lots of those cramming into the Zion shuttle buses with us were thus)
  • a boom in baby boomer retirement travel
  • publicity around the Park Service centennial (and maybe, related, the Ken Burns PBS documentary)
  • the drop in gas prices that began in 2014 (this matches up better date-wise than the centennial or Ken Burns hypotheses)
  • Instagram! This is my favorite, the idea that we’re seeing all our friends’ pictures on Instagram and Facebook and the like, stoking demand for that picture perfect vacation, so we wanna go too. We saw a lot of selfie action.

It’s interesting to think how one might test these hypotheses. The more I look at the graphs, with that sharp jump in 2014 in so many parks, the more I think we need to start with the first hypothesis – some sort of data methodology change. But it doesn’t take much googling to discover active conversation in the communities around the parks that suggests some amount of the increase is real.

By the time we hitched the shuttle back to our car after a day of hiking Zion’s crowded trails, Springdale looked like on long narrow parking lot that ran for miles. Not hard to see why people want to come, but it’s a bit of a mess as a result.

update: Shawn Regan linked to a post he wrote a couple of years ago that there has been a long steady decline in National Park visitation, dating back to the 1980s, when looked at in per capital terms. I updated the data here – long steady climb in visitation by this measure from the 1960s through the late 1980s, then a steady decline. That decline appears to have reversed in the last few years, but still has not come close to its 1980s’ peak:

per capita park visitation