Beetle kill, watersheds and water quality

When beetles kill trees, it changes water chemistry for the folks downstream of the hammered watersheds. And not in a good way (DBP is “disinfection by-products”, study area is in Colorado):

Results demonstrate higher total organic carbon concentrations along with significantly more DBPs at water-treatment facilities using mountain-pine-beetle-infested source waters when contrasted with those using water from control watersheds. In addition to this differentiation between watersheds, DBP concentrations demonstrated an increase within mountain pine beetle watersheds related to the degree of infestation. Disproportionate DBP increases and seasonal decoupling of peak DBP and total organic carbon concentrations further suggest that the total organic carbon composition is being altered in these systems.

Mikkelson et al., Water-quality impacts from climate-induced forest die-off, Nature Climate Change (2012) doi:10.1038/nclimate1724

Denver water use dropping

Bruce Finley in the Denver Post tallies up another western city cutting municipal water use, demonstrating that, for city water users, this is a tractable problem:

Water-saving efforts already have dropped metro Denver residents’ overall average daily usage to 85 gallons, down from 104 gallons in 2001.

Only one city better than Denver in Finley’s review of residential water use:

Albuquerque at 70 gallons a day.

Note that Finley’s talking here about withdrawals, and doesn’t get into the extent to which a portion of cities’ indoor water is reused after treatment, with the exception of a nod toward the way Las Vegas handles its wastewater.

CSFC Index: an NM economic data puzzle

Cheap Shit From China

Cheap Shit From China

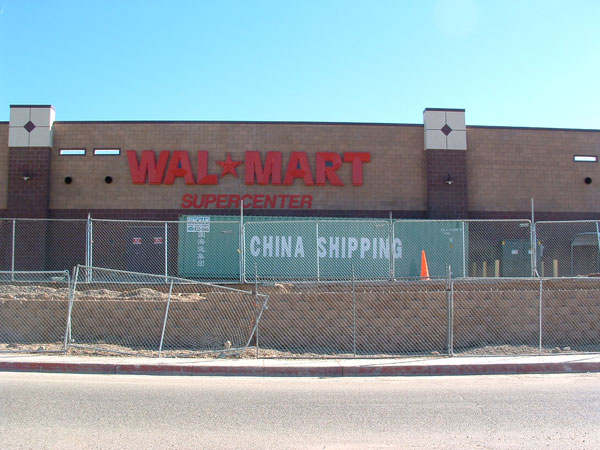
The folks on the Inkstain Economics Desk point to an intriguing puzzle, in the form of 22 shipping containers out behind the neighborhood MegaWalMart this morning.

We’ve long used the Cheap Shit From China index (CSFC) here at Inkstain as a crude but useful economic barometer. The premise is this: WalMart has better data than just about anyone else on aggregated consumer behavior. They also operate their entire system on incredibly tight margins. In the case of the neighborhood MegaWalMart, that includes minimal back end storage space. A number of years ago, I the Inkstain Economics Desk noticed while out on a bike ride while doing their routine data collection that during the holiday shopping season, inventory was spilling out the back of the MegaWalMart, stored temporarily in big shipping containers. So in a sort of random, half-assed fashion, I the rigorous fashion they’re known for, our analysts began counting shipping containers, using it as a visible index of the things WalMart is forecasting about our aggregated economic behavior.

Here’s the problem.

We know New Mexico’s economy is sucking wind, its economic recovery, by one measure, lagging behind every other state in the nation. Yet the CFSC Index stands at 22, an unusually high number for this time of year.

I can see two possibilities. One is that WalMart knows something the Philadelphia Fed doesn’t, and that the CSFC Index could be viewed as a promising leading indicator. The second, which seems more likely, is that the CSFC Index has broken down, perhaps because WalMart is simply leaving empty containers sitting out there because there’s no real demand for them anywhere else. Maybe they’re just sitting there empty. Evidence in support of this is the fact that the containers this morning looked kinda rusty and unused.

I’ve directed the Inkstain economic analysts to go on more bike rides begin updating the data more frequently.

Clarity on withdrawal versus consumption, San Diego style

Regarding my discussion yesterday of the fact that not all water conservation measures are created equal, here’s a nice treatment of the subject by Deborah Brennan at U-T San Diego:

“It’s one of the simplest, most common sense things you can do to save money and restore the ecosystem, especially in San Diego where we have chronic drought,” said Candace Vanderhoff, chief executive of RainThanks & Greywater, and the installer of Murphree’s system. “By retaining the water on the site instead of sending it out to the ocean, we’re able to create more green spaces.”

The key bit here is that “sending it out to the ocean” line. Makes clear where the effluent goes – that San Diego’s clothes washer drain water is being discharged to the ocean, rather than being returned to the system for reuse somewhere else downstream. San Diego’s at the end of the downstream. Kudos.

Water: the withdrawal/consumption confusion

I’d like to sketch out a personal project – something I think needs doing. And, given that this blog’s modest audience includes some other folks who are, like me, involved in public communication on water issues, maybe it’ll serve as a prod for others.

There is an important confusion in public discussions over two very different meanings of mean water “use”.

The first is the water we take out of the system to do something with – a pump stuck down in the groundwater, a canal diverting water from a river, etc. In water wonkery, that’s called a “withdrawal”.

Once withdrawn, some of that water then gets “used up” completely. The water I put on my garden evaporates or transpires from the leaves of the lovely little desert willow. That water has been “consumed”. But some of the withdrawn water, I put back via a toilet flush that makes its way through the Albuquerque sewer plant, gets cleaned up, and is put back in the river. Six miles south of the sewage treatment plant, an agricultural diversion dam grabs that water and diverts it for “use” by downstream farmers.

If you then follow that water downstream, there’s a “lather, rinse, repeat” discussion to be had as farmers apply water to their fields, some is lost to evapotranspiration, some ends up as tail water in ditches that return to the river, some soaks down into the aquifer. Some of the water withdrawn for power plant cooling evaporates – is “consumed”. Some is returned, warmed, to the river.

When you see numbers thrown around, like “power plant cooling represents 49 percent of water use in the United States”, or “Albuquerque residents use 150 gallons of water per person per day”, you’re most often seeing “withdrawal” numbers. And for some purposes, those are important numbers. As Charles Fishman noted in a twitter discussion this morning, power plants are competing with other users sometimes for the water. Warmed water returned from the power plants, or the stuff that makes it to our sewage outfalls, harms ecosystems. There are times when the withdrawal number matters a great deal.

But there also are discussions in which the consumption number is more important.

Let’s use water conservation here in Albuquerque as an example. For a city built in the desert, we probably “use” too much water. So we need to reduce that. Consider two paths to conservation – the low flow toilet and ripping out a patch of lawn – which might generate an equal reduction in the amount of water the local utility needs to deliver to my house each day. Ripping out the lawn reduces the amount of water lost to evapotranspiration. Switching out my toilet may reduce a like amount of water withdrawn from the aquifer or river, but also reduces the amount of water returned to the river via the sewage treatment plant. With the lawn, I’ve reduced my water “use” by both measures – withdrawal and consumption. With the toilet, I’ve primarily reduced my withdrawals.

The discussions quickly spin into complications – system losses in both the lawn and toilet case, embedded water use at the power plant to pump the toilet water to my house, water quality in the river from the treatment of my toilet water. All important discussions. But the whole thing remains entirely too murky if we’re not clear about which sense of “use” we’re talking about when we try to reduce our water use.

Consider some other examples:

  • The distinction between sewage plants that return their water to a river ecosystem, the ocean, a water source (Lake Mead, for example) or that are turned onto a golf course.
  • Putting gray water on your yard versus sending it to the sewage plant. And do I simply reduce my use of non-gray water? Or do I treat the gray water as bonus water and dump more total water on my yard?
  • Irrigation efficiency improvements that reduce withdrawals but increase crop efficiency, increasing evapotranspiration and yields but reducing ag return flows.
  • Groundwater pumping that depletes aquifers but adds surface flows to a river via sewage plant outfalls.
  • Interbasin transfers that remove water completely from one basin while adding it to another, creating enormous entanglements between the question of “withdrawal” and “use”.

For the serious water wonks, this is complex but comfortable stuff. But when the discussion moves into the public arena, lack of clarity in what we mean by “use” can be extremely confusing, and risks bad policy.

To be clear: there are still important reasons for the low-flow toilet, or making power plant cooling more efficient. But not all reductions in water “use” are the same. We need more clarity in this discussion.
Are Phoenix and Las Vegas in “the west”?

At the 2010 census, about 70 percent of the population of Nevada lived in the greater Las Vegas metro area. The comparable Phoenix/Arizona percentage is something on the order of 68 percent.

“The west” as a conceptual framework for thinking about those lands beyond the hundredth meridian has some utility. But rather than probing John Wesley Powell’s notions of life in this arid land or Frederick Jackson Turner’s ideas about the frontier, maybe the salient reference point today is the Case-Shiller Home Price Index:
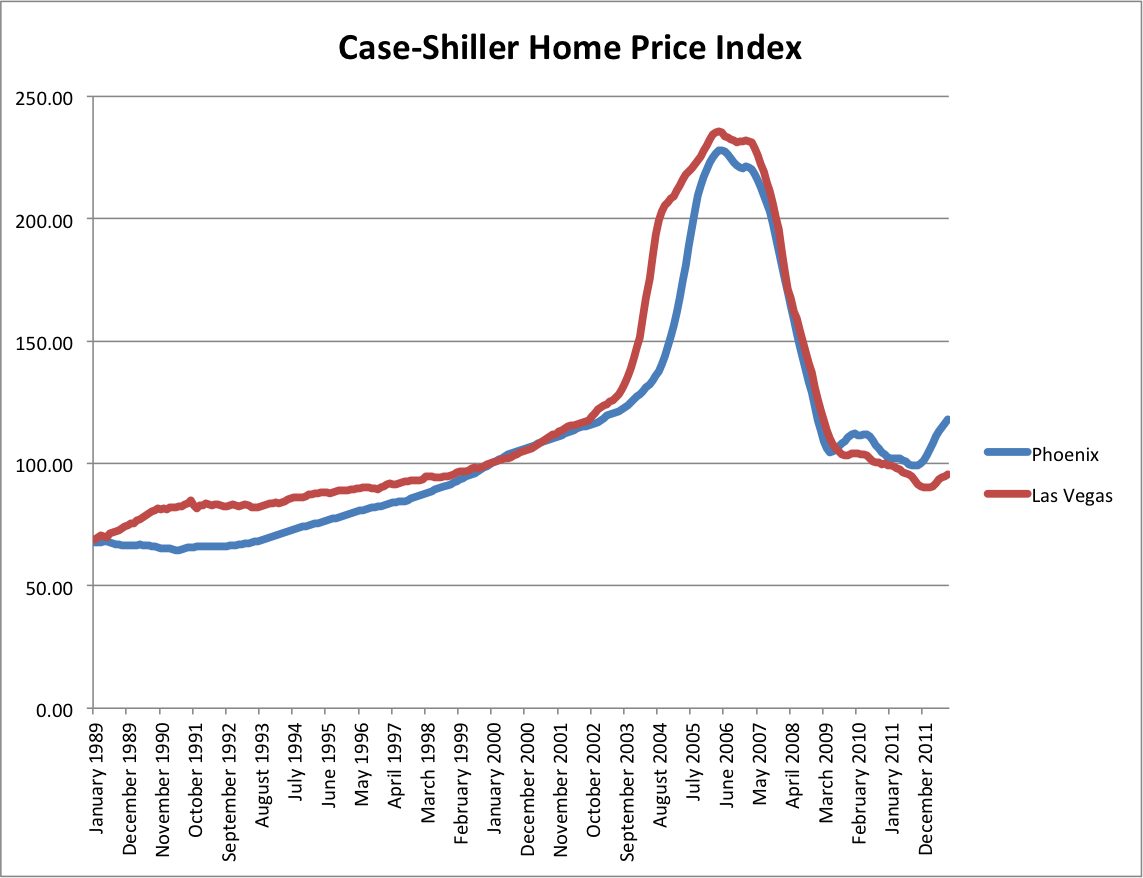
Case-Shiller Home Price Index

Case-Shiller Home Price Index


“the life force is strong, John”

Many years ago, when I lived in California, I was walking down the street with a friend, an old Italian-Catholic grandmotherly woman who I knew through her work fighting against the construction of a freeway through our town.

I was sharing my fascination with these tenacious little juvenile palm trees that had found a niche in the gravel beds along the railroad tracks that ran through town.

“The life force is strong, John,” she said in response, with a smile of religious wisdom.

Here’s some poppies from last spring, doing what they do:

the life force, strongly

the life force, strongly

Not too soon for Sandy lessons

Jeff Mount from UC Davis:

The San Francisco Bay Area business community should be taking notes. This trifecta of high tides, storm surge and intense rain is also a Bay Area scenario. Scientists and a host of government agencies have been warning about such an event for years.

It may not appear so on a map, but the Bay Area has half of California’s shoreline. Unlike the rest of the state’s coast, most of that shoreline is along reclaimed lowlands that are prone to flooding from the bay and surrounding creeks – the same as waterfront cities in New York and New Jersey.

A major storm in the Bay Area would put more than 140,000 people at risk of serious flooding, along with $30 billion worth of public assets that include the Port of Oakland, two major airports and 800 miles of roadways.

It’s not tropical storms that pose the risk, Mount says, but “atmospheric rivers”.

Antelope Island and the notion of climate variability

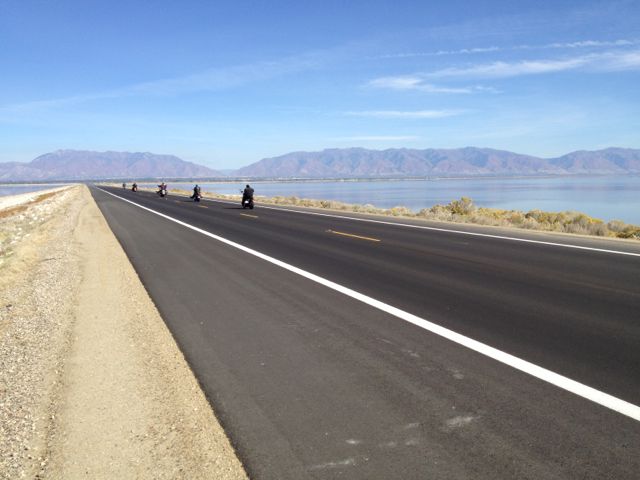
Antelope Island Causeway, Great Salt Lake, October 2012

Antelope Island Causeway, Great Salt Lake, October 2012

On a quick weekend dash to Ogden earlier this month, I squeezed an hour out of my return trip to the Salt Lake City airport to make the drive out the causeway across the Great Salt Lake to Antelope Island.

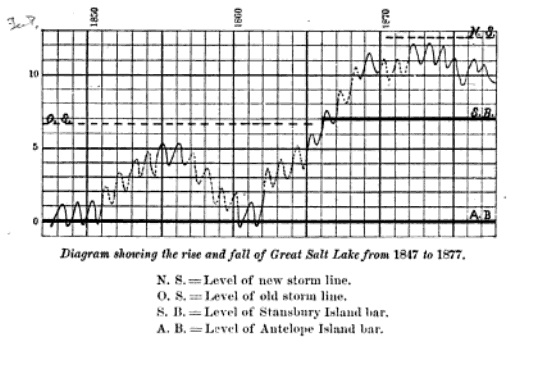
When G.K. Gilbert, under the direction of John Wesley Powell, was trying to sort out the climate history of the region during the mid-19th century, he turned to the early Mormon herders for help. The Great Salt Lake was then a great climate integrator, a closed basin that rose during wet times and fell during dry – sometimes allowing access to Antelope Island, sometimes not. There were other similar sites, most notably the access to Stansbury Island. The herders kept track, and Gilbert was able to use their stories to generate a crude but usable “paleoclimate” record over the previous 30 years.

G.K. Gilbert's Great Salt Lake level reconstruction, from the Report on the Lands of the Arid Region

G.K. Gilbert’s Great Salt Lake level reconstruction, from the Report on the Lands of the Arid Region

I’ve always loved the story (I included it in my book), because Gilbert was so clever and because, if you look that drop in the lake’s level he identified beginning around 1855, he seems to have pretty much nailed the story that 21st century scientists now understand about that time period.
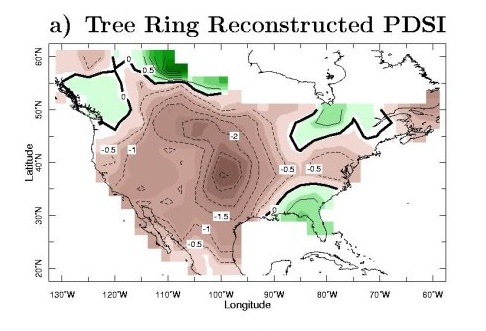

As far as I know, we have no rain gauge data from that time period around the Salt Lake, but tree ring records have been used to reconstruct what Richard Seager calls “the Civil War drought,” extending from the mid-1850s to the mid-1860s.

The drought was quite broad, as Seager’s map (based on tree ring data compiled by Ed Cook at LDEO) shows.

Palmer Drought Severity Index, 1856-1865

Palmer Drought Severity Index, 1856-1865, courtesy Richard Seager, LDEO

The culprit? La Niña. Seager’s group used the relatively sparse ocean temperature data reconstructions available, which are based on ship-board records, to drive climate models. They showed a persistent La Niña phase, and driven by that, the models did a nice job of reproducing the spatial nature of the drought as shown in the tree ring records.

And in Gilbert’s clever 19th century reconstruction as well. For a paleo nerd, worth a quick pilgrimage on the way to the airport.

(Seager’s group has a great web page summarizing their work on 19th century drought.)