Desal is apparently now a jobs program

I’m all for a serious discussion about the costs and benefits of desalination as a source of water supply in the arid southwestern United States. But I find this argument, from Ted Owen of the Carlsbad, Calif., Chamber of Commerce, less than helpful:

Jobs. Everyone in business and government is talking about the need to create jobs, but so few seem to have any real jobs to offer. On Tuesday, the Carlsbad City Council will be put to the test, and we will witness a display of leadership that will help reaffirm our faith that local government can be part of the jobs solution.

On the City Council’s agenda is an agreement between the city and the San Diego County Water Authority that will advance the long-awaited Carlsbad Desalination Project. The agreement probably doesn’t give the city everything it originally wanted, and the same is likely true for the County Water Authority. And it is this compromise that exemplifies what leadership is all about —- having the foresight to put the greater good of the region above parochial interests.

The desalination project is one of the largest shovel-ready water infrastructure projects in the state of California. It will support 2,000 skilled jobs and generate more than $350 million in economic stimulus during construction, and contribute more than $50 million per year to the regional economy once operations begin in 2014.

It is also the case that having Carlsbad City Council hire hooligans to go around breaking windows downtown would create jobs for people who fix windows. But that is not sufficient motivation for hiring the hooligans. Now, to be fair, Owen does mention in passing the argument that the desal project offers some water policy benefits as well. But desal only works if it’s affordable, which has been one of the rips against the Carlsbad project. And the notion of the desal plant as a jobs program works best if it’s extravagantly expensive. It seems the two lines of arguments are at cross purposes here.

Badlands Express

If our carny rides are reflections of our deepest cultural impulses*, what does the “Badlands Express” ride at the New Mexico State Fair tell us about the modern West? Are these kids standing in for our lost Hayduke?

Badlands Express, New Mexico State Fair, September 2011

Badlands Express, New Mexico State Fair, September 2011

*Note: I don’t think our carny rides are reflections of our deepest cultural impulses. I just thought the cactus and fake little 4×4’s were hilarious. They had Fords too.

Tree rings and fire history in the Appalachians

While I’ve been writing about fire history in the southwest, the issue is coming up all over. As in this last week, from Texas A&M, on using tree rings to tease out fire history in the Appalachians:

By piecing together the fire-scar record from numerous trees, he and his students and collaborators learned that fires occurred frequently, about once every 2-10 years. He found some trees with scars dating back to the mid-1600s.

As we’ve seen here, the anthropogenic influence is easily detectable:

[F]ires showed a dramatic decrease after the 1930s.

“That’s about the time the U.S. Forest Service and other agencies started to increase public awareness of forest fires, and they introduced the ‘Smokey the Bear’ campaign to tell people that they could prevent forest fires,” he says. “And when a wildfire did occur, they suppressed it to halt its spread. Their efforts worked — the trees show that it did because they are fewer fires in the last 50 to 70 years.”

There’s lots more on the stories tree rings tell in my book, The Tree Rings’ Tale.

The farm bill and water policy

Wayne Bossert, who manages the Northwest Kansas Groundwater Management District No. 4 on the famed Ogallala Aquifer, raised the interesting issue recently in testimony at a Senate field hearing of the effect of federal agricultural policy on water:

Historically the farm bill has been blamed for promoting fencerow-to-fencerow corn production due to it’s design and implementation, which of course, does little for curbing water use in irrigated ag areas. So, we were thinking that a farm bill that would promote less water intensive cropping choices – especially in water stressed or enhanced management areas – could conserve water at no additional program cost. This is apparently a very difficult thing to do, but we asked again, anyway.

We also asked for a crop insurance program that would insure limited irrigation operations. This would actually reduce liability and be less expensive than the current program. It’d allow irrigators to implement a water conserving, limited irrigation plan on land that had been fully irrigated, but also receive a critical level of crop insurance discounted proportionately with the expected yield goals of their limited irrigation plan. This could save a lot of water as well, so we asked for it.

We also asked that NRCS EQIP and AWEP programs support partial water use set asides – allowing producers to enroll the least efficient portions of their irrigation operations rather than the entire irrigated acreages. The water conservation would be the same, at reduced program costs, while returning a higher economic return for the producer.

When I asked around about this issue, I couldn’t find folks here in New Mexico tracking this issue in terms of water use here, but a friend pointed me to the work of George Frisvold (this from 2004):

Agriculture accounts for 80% of U.S. consumptive use of freshwater and has been identified as the largest contributor to nonpoint source water pollution. Over the last 20 years, agricultural policy reforms have greatly reduced, though not eliminated, incentives to overuse water and chemical inputs and have improved targeting of conservation programs to achieve environmental benefits. Recent changes provide greater incentives for voluntary reallocation of water from agriculture to other uses.

I’d love pointers to other folks thinking about this issue.

Stuff I wrote elsewhere: It didn’t all burn like that

From yesterday’s newspaper, a reminder that not all the area within the boundaries of this year’s big New Mexico forest fires is burned to an ugly, indecipherable ecological cinder (sub/ad req):

There is good reason to visit the moonscape, and to talk about what happens next to the ecosystem there — the subject of a future story, and the main reason Adolphe and I asked Allen to show us around. But there is something misleading about the way journalists cover disasters. We are drawn to the worst of the worst — the most devastating flooding, the epicenter of the earthquake damage zone, the moonscape around St. Peter’s Dome.

Remember this as you watch us going into disaster mode. The situation is likely not as severe as the parts we’re showing you.


Newspaper exonerates Salton Sea of charges it stinks. Or does it?

Salton Sea, 1907

Salton Sea, 1907, photo courtesy USGS, credited to G.K. Gilbert

In a hard-hitting exposé, the Desert Sun earlier this month seems to have conclusively cleared the Salton Sea of charges that it smells really bad:

The smell seemed to be everywhere — except the place where people usually think it comes from.

A pungent, sewer-like odor in the air was noted Friday morning by people across the Coachella Valley.

“Eight o’clock, I went outside to walk the dog and said, ‘Oh my goodness. What the hell is this?’” said Bryan Cox, a resident of northern Palm Springs.

But it was a nice day Friday along the shore of the Salton Sea, the 35-mile-long lake formed in a natural basin by agricultural runoff.

But wait…

But one employee coming in from east La Quinta took note of the odor. “He said it was the Salton Sea,” Hermann said.

Palm Springs ecologist Jim Cornett said the usual suspect is, in this case, the correct one.

“I noticed it right away when I went out to get the paper, and I said ‘Oh, Salton Sea,’” he said.

I am so confused. Does the Salton Sea stink? Anyone?

New Rain Gauge

I am a weather nerd.

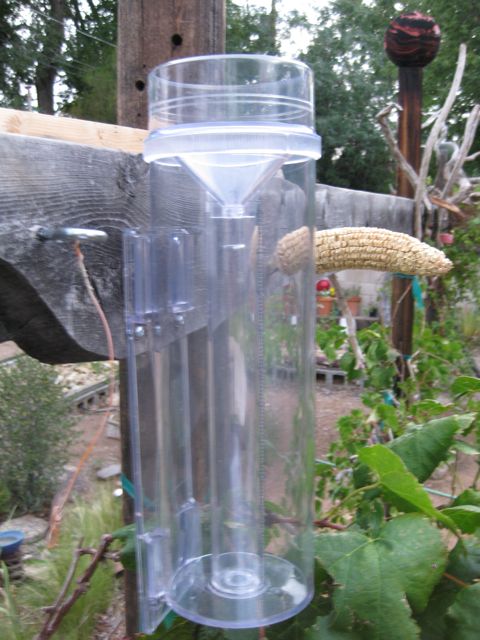
So it was with great excitement that I unpacked my new official CoCoRaHS RG202 4″ Rain Gauge this evening.

New Rain Gauge

New Rain Gauge

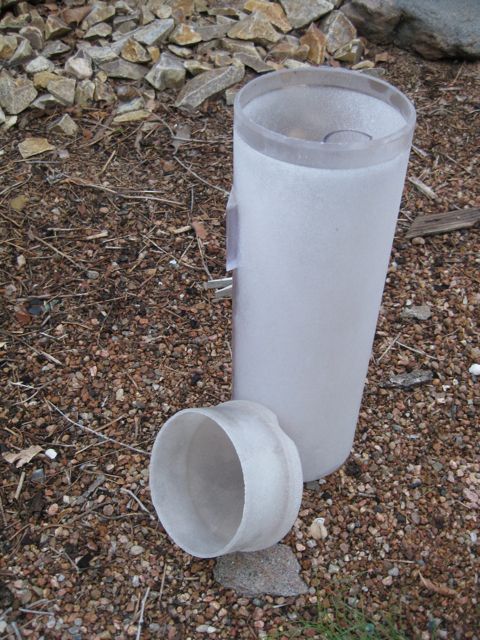
It replaces an identical old one that I put up in the back yard in September 1999 when I joined the local National Weather Service office’s CityNet group of volunteer observers. I recently signed up for CoCoRaHS, and bought a new gauge. The old one was pretty beat up, but served me well:

Old Rain Gauge

Old Rain Gauge

Will Sunbelt Growth Return?

The question of how much water we’ll need in the Southwest going forward is dominated by uncertainty over what future population growth will look like. And I confess that I’ve got no earthly idea how to think well about this question.

Consider Phoenix. In his new ebook The Gated City, Ryan Avent argues that Phoenix is an exceedingly unpleasant place to live. Population growth in Phoenix, Avent argues, has been fed primarily by the fact that people would rather live elsewhere because Phoenix is so frickin’ hot, but can’t because the places they’d rather live are so frickin’ expensive:

[C]onsider Phoenix. Arizona is a beautiful state, but the Phoenix area is less climatically diverse than coastal California; it can not uncharitably be described as a desert. For fully a third of the year, temperatures above 100 degrees are commonplace.

San Francisco’s weather, meanwhile, is lovely, Avent argues. So why, he asks, have people been leaving the San Franciscos of the world and flocking to Phoenix? Cost of living, and, in particular, “the exorbitant price of housing in the Bay Area.”

Supply and demand – here’s housing starts in Phoenix and San Francisco MSAs:

San Francisco, Phoenix housing starts

San Francisco, Phoenix housing starts

My point here is orthogonal to Avent’s central argument, which has to do with urban economies in the United States (and is really interesting, I recommend the book). My question has to do with what happens next to that blue Phoenix housing construction line and others like it all over the southwest.

A new report out of Arizona State University’s Morrison Institute argues that we should expect the blue line to begin rising again, and that therefore water policy makers need to act accordingly. The Institute hired Marshall Vest at the University of Arizona to revisit population projections he made three years ago in light of the recent drop in the blue line above:

It is clear … that population growth has dramatically slowed. But whether the trend line has changed slope, or just suffered a blip, is not entirely clear. Vest’s 2008 projections for Maricopa, Pima, and Pinal counties called for 10.1 million residents in 2040 as the “most likely” population projection.

The “low” scenario was 8.9 million. The new projection is for a “most likely” 9.0 million—virtually identical to the old “low” number. Vest concludes that overall population growth will ultimately return to the Sun Corridor at about a 2% annual rate from 2015 to 2040. Net migration—people moving into the Sun Corridor minus those moving out—will return to an “average” of 80,000 per year by 2015. In March 2011, census data was released showing that from 2000 to 2010 Arizona’s population grew by 25%, but housing supply increased by 30%. Housing stats have tended to be viewed as a proxy for population growth, leading in this decade to an overestimate. Phoenix, which had touted itself as the fifth largest city in the country, fell back below Philadelphia when the numbers were counted.

Despite the slowdown, the projection of a 9 million person Sun Corridor by 2040 remains the most likely possibility.

As I said earlier, I have absolutely no idea how to think about the question of what happens next, other than thinking it’s a dominating uncertainty.

update: Eli makes a good point in the comments that suggests I’ve chosen data poorly in the graph above, but I don’t thin it invalidates the underlying point. Rather than single-family housing (as seen above) here is all housing. It shows the same pattern. Avent’s argument is that zoning choices, rather than underlying real estate availability, is what’s driving the shape of these curves:

Phoenix v. San Francisco - all housing starts