By Eric Kuhn
The Colorado River’s natural flows are shrinking by 9% per degree C (1.8 F) of warming as climate change continues to sap the river’s flow, according to an important new study by Chris Milly and Krista Dunne of the US Geological Survey. Milly and Dunne also conclude that increasing precipitation is unlikely to offset this temperature induced drying. The study adds important additional evidence that not only will climate change reduce the river’s flows in the future, but that it is already happening – the already over-tapped Colorado River is facing a future with even less water.
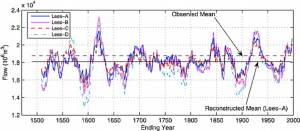
tree ring reconstruction of the Colorado River’s flow, from Woodhouse, Connie A., Stephen T. Gray, and David M. Meko. “Updated streamflow reconstructions for the Upper Colorado River basin.” Water Resources Research 42.5 (2006).
My one caution is that like almost all other similar studies, for baseline purposes, Milly and Dunne use the Colorado River Natural Flow Data Base (NFDB) for the annual natural flows at Lee Ferry. The Natural Flow Data Base is maintained by Bureau of Reclamation scientists based at CADSWES in Boulder, Colorado. The data base shows monthly and annual natural flows at critical points in the basin including Lees Ferry. It is updated approximately annually when the most recent year for which data are available is added. The most recent version was released in February 2020 and covers water years 1906-1918. The version used by Milly and Dunne was released in March 2019 covering 1906-2017.
While the Natural Flow Data Base provided an important source of baseline information for Milly and Dunne, as well as other recent studies of the impact of climate change on the Colorado River, it is important to be aware of its shortcomings.
Uncertainty about early data
The farther we go back in time, the less confidence we should have in the data. Natural flows are gauged flows adjusted for upstream human hydrologic modifications. Before 1930 there were relatively few gauging stations in the entire basin and before June 1921 there was no gauge at the critical Lees Ferry location (Water Year 1922 is the first full year of measured flows at Lees Ferry). The major sources of consumptive use above Lees Ferry are irrigated agriculture (well over 90% of the use before the major dams and export projects were built beginning in the 1950s). Irrigation uses are the most critical variables used to calculate the natural flows reported in the NFDB, but before the late 1940s the data available on acres under irrigation and cropping types were very sparse. The major source of data was the federal irrigation census conducted every five to ten years. Beginning in the late 1940s, project planning efforts by the Bureau of Reclamation led to much more and better data on irrigation use.
Start date
Although the NFDB begins with Water Year 1906, both the Bureau of Reclamation and USGS published data sets with estimated annual natural flows at Lees Ferry starting well before 1906. In Science Be Dammed John Fleck and I make the case that 1906 was likely picked in the 1960s by Commissioner Floyd Dominy to give the Central Arizona Project the best water yield (read the book). It is a decision we live with today. Before the 1960s, Reclamation studies routinely used natural flows back into the 1890s. There are annual natural flow estimates for Lee Ferry of comparable quality to the pre-Lees Ferry gauge estimates that go back to about 1878. Why is this important? The early 20th Century pluvial began in 1905/06 and lasted through about 1930. In the three decades before 1905 conditions in the Colorado River basin were much drier, similar to the Colorado River Basin in the 1930s to 50s (thus Dominy’s marketing decision). The choice one makes about which period of record to use makes a difference in how the river’s estimated mean annual flow:
- 1906-2018: 14.8 million acre-feet per year (MAF/yr).
- 1878-2018: 14.4 MAF/yr.
Based on tree-ring based reconstructions we now understand that the 1906-30 pluvial was not only wet, it was extraordinarily wet. In an observation first made by Charles Stockton and Gordon Jacoby in their seminal 1976 paper reconstructing Lee Ferry Flows back over 400 years, they conclude that the periods of record used by the Bureau of Reclamation that include the 1906-30 pluvial will be skewed to the wet-side. Based on more recent reconstructions, we now believe that 1906-30 was one of the two or three wettest 25-year periods in the last 1400 years (perhaps even the wettest). The long-term average natural flow at Lees Ferry from the most recent reconstructions (Treeflow.info 2018) is about 14.3 MAF/yr.
Implications of the data’s shortcomings
What are the implications of the cautions I’ve listed? For starters, when comparing the recent 2000-2018 “drought” period with periods of record that begin with or include major portions of the 1906-30 pluvial, the magnitude of the current “drought” is often overstated.
Based on the NFDB, the mean annual natural flow at Lees Ferry for 2000-2018 was 12.47 MAF/yr, 15.5% less than the 1906-2018 average of 14.76 MAF/yr (“normal”). However, using a different baseline such as the post-pluvial period of 1931 -2018, that same drought period is only 10% less than “normal”. Given the uncertainties in the natural flow data base before 1930, the use 1931-2018 is a reasonable decision (and one that is gaining favor with some of the basin’s water agencies).
For research purposes, study authors might want to give more consideration to the uncertainties in the NFDB. They should consider using a periods of record starting in 1922, after there was an actual gauge at Lees Ferry, or 1931, the post pluvial period and the year after the Boulder Canyon Project Act funded additional gauging stations, or even 1948, the year soil scientists, Blaney and Criddle, were tasked with improving our understanding of irrigation consumptive uses in the Upper Basin. If possible, study authors may even want to compare their results with the long-term paleo record mean of 14.3 MAF/yr. All are reasonable approaches that will yield slightly different results. As with Milly and Dunne, for many studies, the period of record used may be driven by other data limitations.
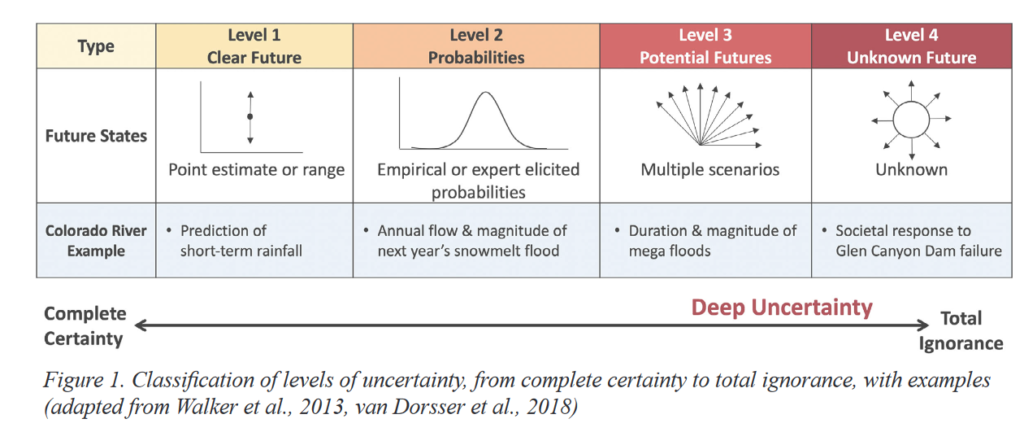
The bottom line is that there are a range of different answers to the question of what is the normal flow of the Colorado River at Lees Ferry. Milly and Dunne, along with other researchers have used the Natural Flow Data Base to help us understand the impact of climate change on the Colorado River, have made critical contributions. But as we move forward with our policy responses, we need to be open about the uncertainties inherent in the data we are using. An effort to study the sensitivity of climate change analyses to the uncertainties in the NFDB would be a valuable addition to our understanding.