A watery border

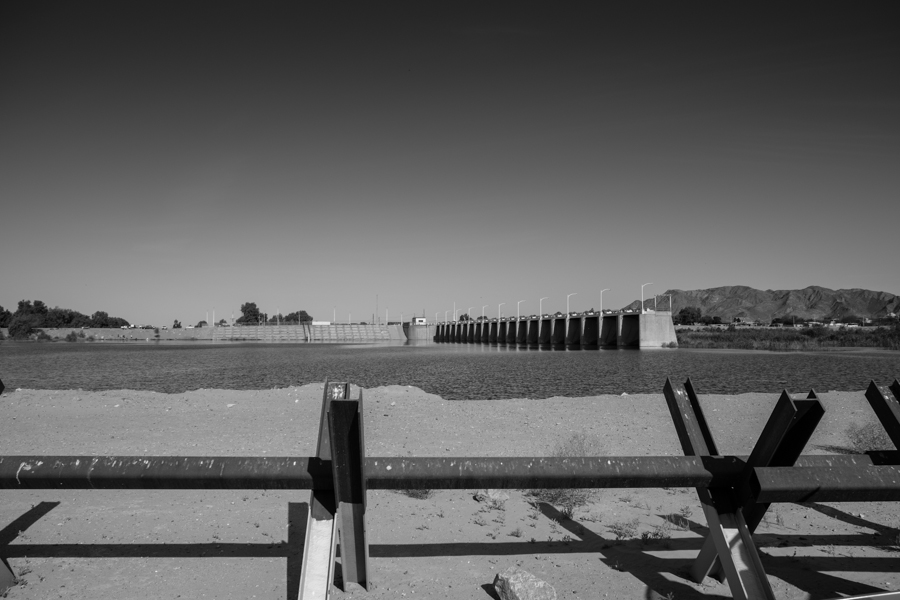
Morelos Dam, seen from the U.S. side looking into Mexico, March 2014

Morelos Dam, seen from the U.S. side looking into Mexico, March 2014

This is a picture of the downstream side of Morelos Dam, on the U.S. Mexico border west of Yuma, Ariz. I took it in March, when there was water flowing downstream, into Mexico. That is an unusual sight. This is usually the point where the Colorado River ends.

It’s not entirely clear to me where in this picture the actual U.S.-Mexico border is – out there somewhere underwater. Normally this is not much of an issue, though I’ve been there when it’s dry and there’s no less clarity on the land itself. I’m pretty sure the day I was there when it was dry I crossed back and forth between the two countries on foot without realizing it quite a few times.

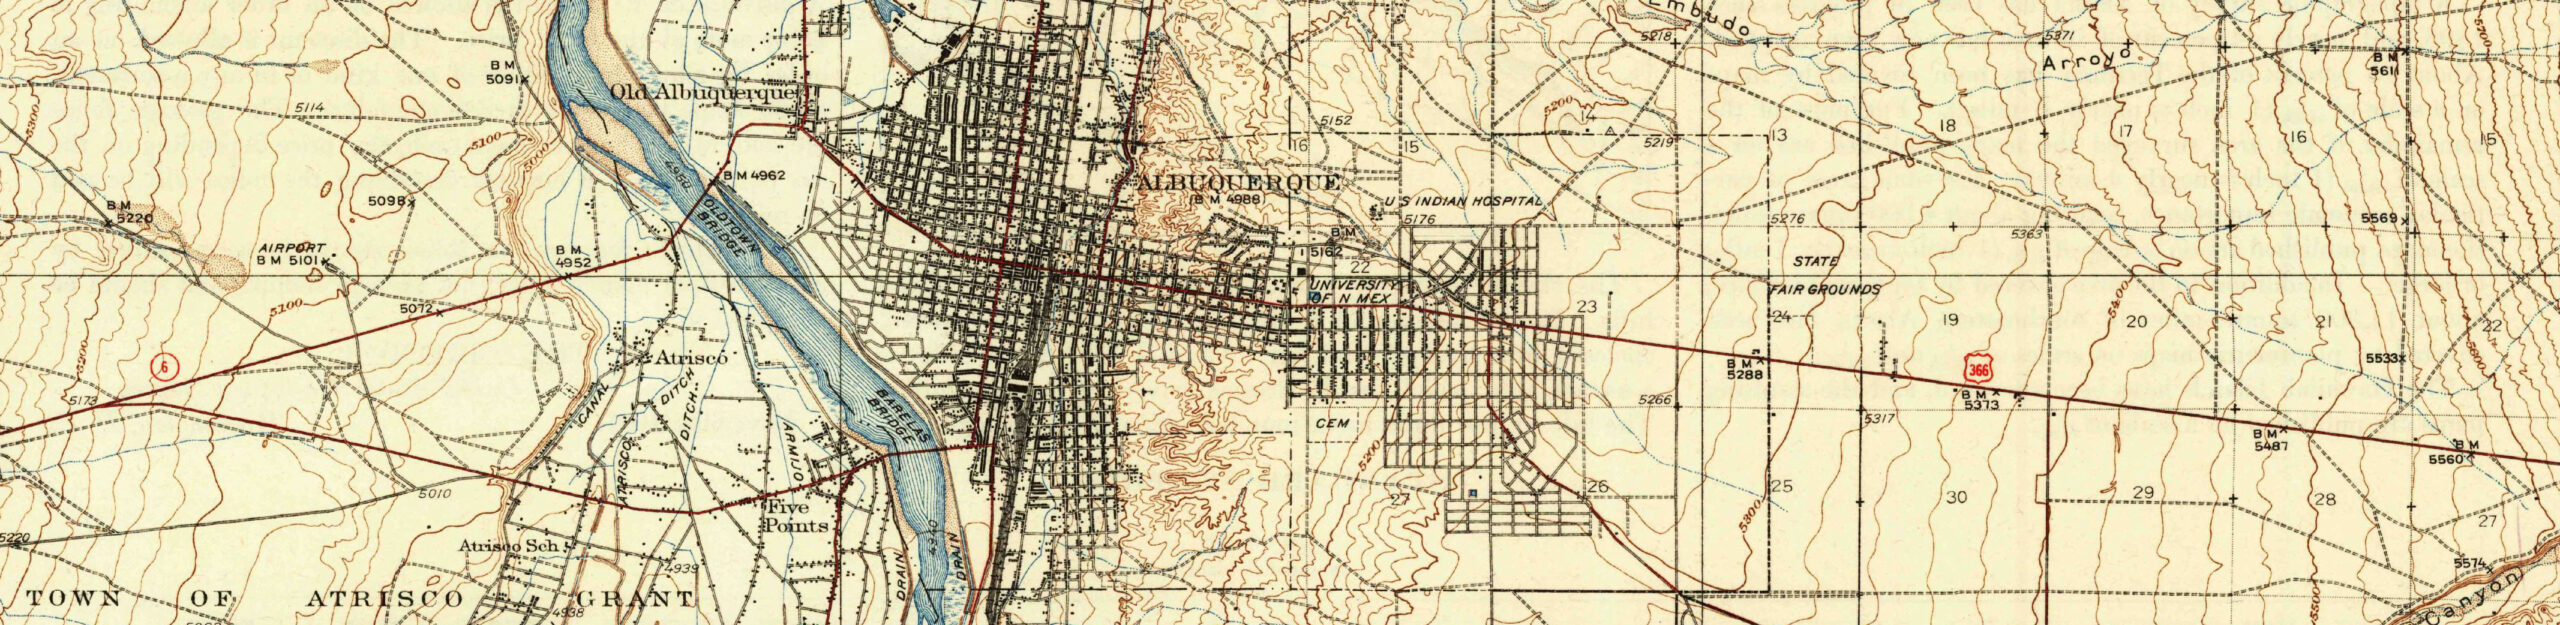
Here’s a map.

Lake Mead’s problem: It’s about the lower basin structural water deficit, not the Bellagio Fountain

tl;dr Vegas is an easy target, but Lake Mead’s problems involve far more than Sin City’s profligacy.
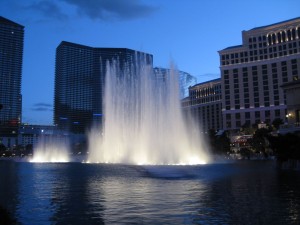
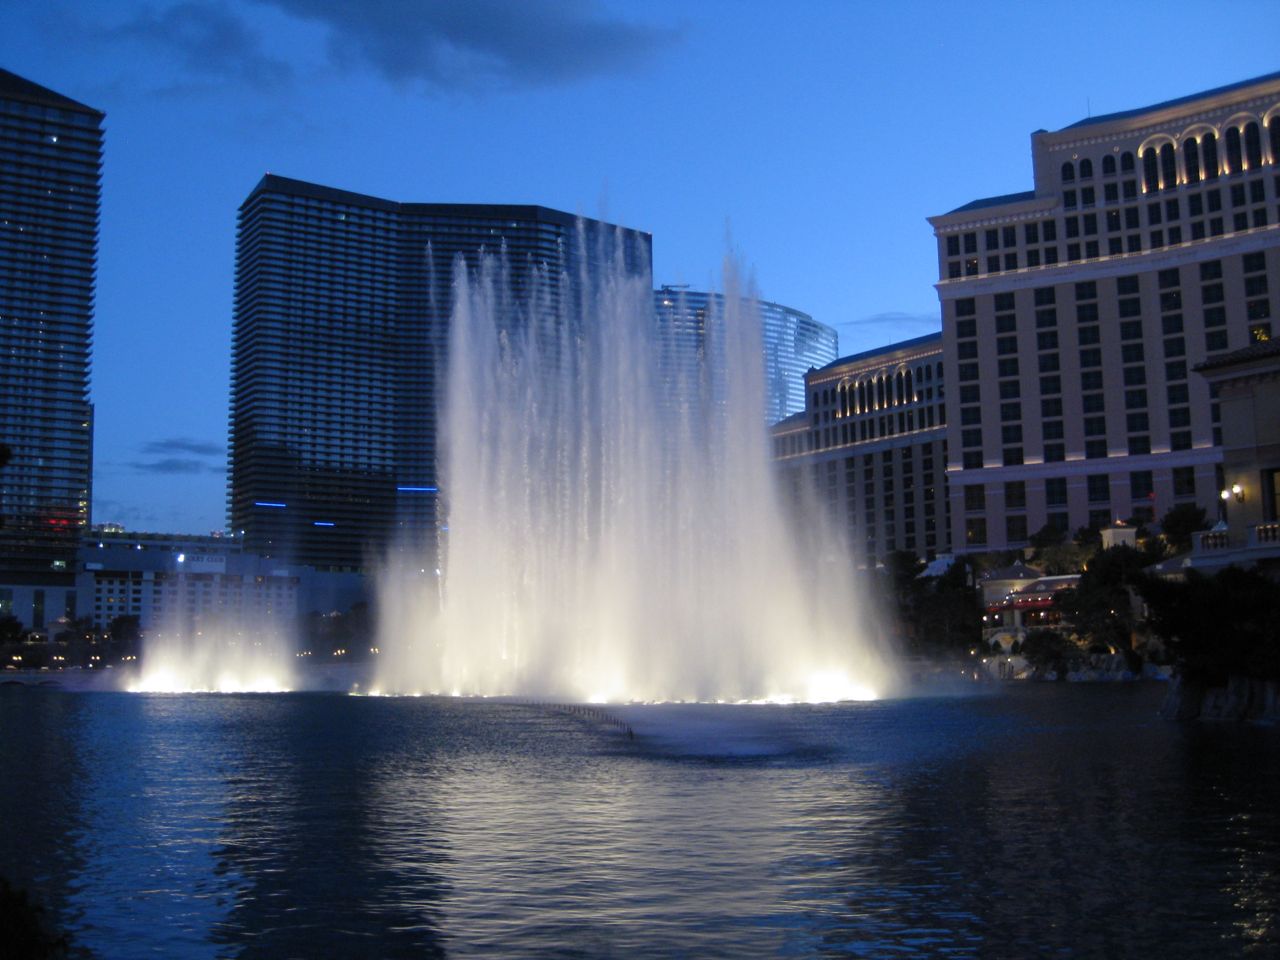
Bellagio Fountain, Las Vegas NV

Bellagio Fountain, Las Vegas NV

Longer version: As Lake Mead drops toward a record low some time next month, there’s a temptation to draw a dotted line to the Bellagio Fountain, 30 miles to the west, and point a finger of blame. It’s not the fountain itself, but rather the water excess of Las Vegas that it symbolizes, that draws the easy comparison, as the energetic and extremely widely read Eric Holthaus did in a recent Slate post that tripped straight from Mead’s record lows to the gaudy fountain on the strip:

If it wasn’t used to water lawns or wow tourists at the Bellagio, it could be used for drinking.

And this is true, but it misses the crucial point embedded deep within the arithmetic underlying Lower Colorado River Basin’s water balance sheet. The question of whether Las Vegas’s water use is unnecessarily profligate is an important one, but it’s of only marginal importance when talking about the risk the Southern Nevada city faces.

Las Vegas could do a dramatically better job of conserving water – shut down the fountains, get rid of the lawns – and still see Lake Mead drop uselessly from beneath its feet. Here’s a graph of how we use Lower Colorado River Basin water that may help explain this:

The blue bars are 2013 consumptive use by the nine largest water users in the lower basin. The orange bar that I snuck in there for comparison is what we’ve been lately calling the “structural deficit” – the excess water used in the lower basin above and beyond the full annual normal year allocation. Southern Nevada – essentially the greater Las Vegas metro area – consumed 223,563 acre feet of water. (source – pdf) Las Vegas could cut its Colorado River water use to zero – blow up all those casinos and leave Vegas to desert dust – and Lake Mead’s structural deficit would still be close to a million acre feet a year.

Look again at the big bars in the chart above. Have you heard of the Wellton-Mohawk Irrigation District? It uses more water than Vegas. Coachella? In addition to some sort of hipster music festival every year, they also use water to farm the desert – more water than Vegas uses to harvest tourist dollars. You’ve of course heard of the Imperial Irrigation District. It uses ten times as much water as Vegas.

I’m not here to defend Las Vegas’s water use. Could they do more to conserve? Absolutely. There’s a serious conversation to be had about that city’s approach to life in the desert. They will have to be to be part of the solution to Lake Mead’s problems. But until the broad societal conversation embraces all the water users, rather than wagging an accusing finger at the Bellagio Fountain, we’re not going to get anywhere in dealing with this problem.

a note on the data: The numbers in the graph are total consumptive water use, as reported in the U.S. Bureau of Reclamation’s 2013 Colorado River Accounting and Water Use Report for Arizona, California, and Nevada (pdf). The numbers represent all large water users in the Lower Colorado River Basin, those whose water is drawn from Lake Mead. These users account for 95 percent of the U.S. Lower Colorado River Basin consumption. The rest is scattered among a bunch of much smaller users, which I was too lazy to graph, plus it would have been too wide. A number of the users shown, including Las Vegas and the Colorado River Indian Tribes, withdraw more water than shown from the river, but then put some back. The numbers in the bar chart represent the net of those two numbers, what in the jargon is called “consumptive use”. For several, including Yuma County ag, I’ve lumped more than one water user into a single bar.
In the West, what used to be snow, falling as rain

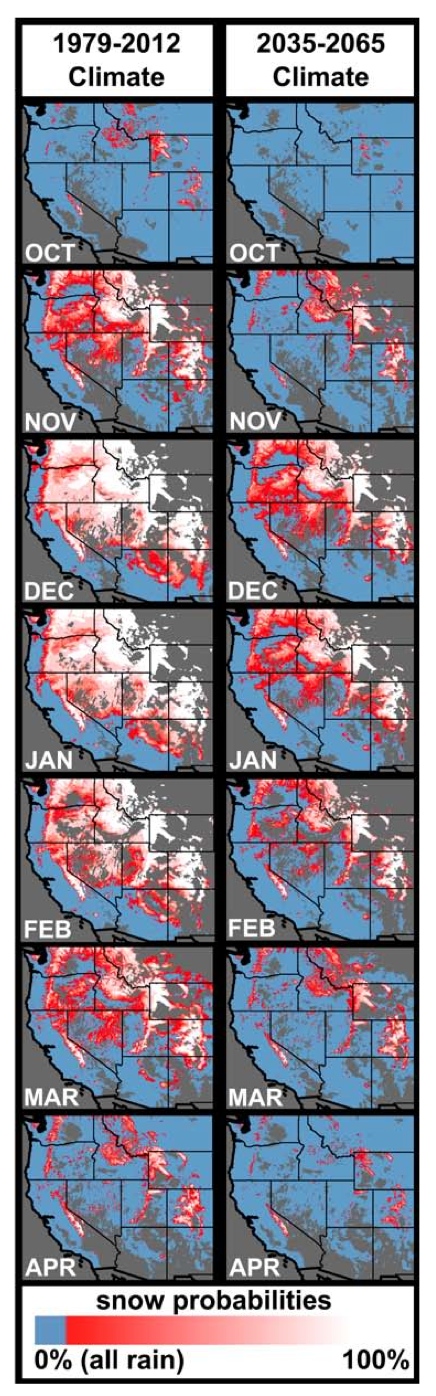
The current and future extent of the strongly rain-dominated (blue), strongly snow- dominated (white), and rain-snow mix (pink to red) areas within the western US based on wet-day mean temperature. From Klos et al., Extent of the rain-snow transition zone in the western U.S. under historic and projected climate, DOI: 10.1002/2014GL060500

The current and future extent of the strongly rain-dominated (blue), strongly snow- dominated (white), and rain-snow mix (pink to red) areas within the western US based on wet-day mean temperature. From Klos et al., Extent of the rain-snow transition zone in the western U.S. under historic and projected climate, DOI: 10.1002/2014GL060500

If I was trying to manage water in California, these maps would give me the heebie-jeebies.

It’s from a new paper (AGU-walled) by Zion Klos and colleagues extending our knowledge of the shift from snow to rain in the high country of the western United States as a result of warming temperatures.

Here’s why this matters. Water infrastructure – the dams, canals and pumps we’ve built to move water around the West from where it falls to where we want to use it in our cities – is predicated on mountain snowpack serving as an annual reservoir. It sits in the mountains safely frozen away until spring and summer warming brings it down the streams and rivers to the places where we can catch it.

In some cases, like on the main stem of the Colorado River, we’ve built enormous dams to catch it whenever, storing multiple years’ worth of water during wet years to dole out during dry. But in other places, the systems operate far closer to the margin, capturing and using on an annual basis. The snowpack itself, rather than Hoover Dam, acts as the reservoir in places like New Mexico and California. If it comes off too early, we lack the infrastructure to catch it and spread its use out in time, into the later season.

California’s Sierra Nevada is one such snow reservoir, which appears striking in the Klos et al. map.

One of the implications is that the old water managers’ notion of keying operational decisions on the April 1 snowpack will likely need to go, the authors write:

Mountainous regions in the western U.S. have historically been strongly snow-dominated from November through March. The sensitivity analysis revealed that by mid21C the length of snowfall-conducive temperatures over many western mountain ranges will be reduced from approximately five (November – March) to approximately three (DJF) months of the year…. Considering these temporal changes, it will be critical for the water resources research and management communities to look beyond the April 1 standard for measurement of approximate peak (snow water equivalent).

Chris Milly wrote a great paper on the death of “stationarity” in 2008 (see this nice Michael Campana piece on the implications). The new Klos et al. paper is part of the work that is needed to dig into the details of what this all means for western water management.

Steamboats and pickup trucks in the Colorado River

A century and a half ago, there was enough water in the Yuma stretch of the Colorado River to sink a steamboat:

On this date in 1854, the first steamer on the Colorado River, The Uncle Sam, sank at Pilot Knob.

Today, it’s pickups, stuck in the sand:

Yuma Station agents patrolling near the Colorado River saw an abandoned Jeep Cherokee parked near the Normandy barriers. Upon closer inspection, agents noticed a large part of the Normandy barriers had been cut. Nearby, several individuals were trying to free a Chevy pickup truck stuck in the Colorado River. As agents approached the truck, the individuals fled to Mexico. The truck contained 44 bundles of marijuana with a combined weight of 855 pounds, worth an estimated $427,500.

South of the border, tension about highest and best use of Colorado River water

Preparing a talk I’m giving next week about Minute 319, the Colorado River environmental pulse flow and its broader implications for western water management, I ran across this new piece by environmental journalist Cesar Angulo about the mixed feelings in Mexico about the effort:

According to Arroyo Gonzalez, these reforestation projects have a very positive effect on agricultural areas by helping to reduce high temperatures, as well as recharging aquifers used by the agricultural sector. However, he recognizes that there is still a lack of information among farmers about the restoration projects and their extended benefits on the farming community.

There is even some doubt among farmers about where the water for the pulse flow comes from, and if it is the best use of water, especially since the demand for water in the region is so high. Some believe that the first priority should be to irrigate land to produce food, and deliveries for ecological purposes should be secondary.

In search of summer rains

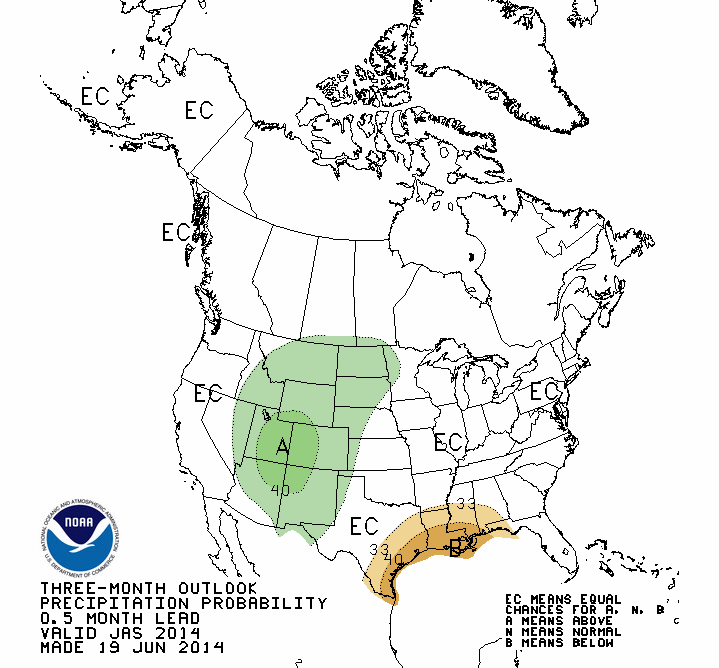
Summer rains aren’t a big part of the Colorado River Basin’s water supply story, but they don’t hurt. So here’s an optimistic map, published this morning by the Climate Prediction Center:

July-September outlook, courtesy CPC

July-September outlook, courtesy CPC

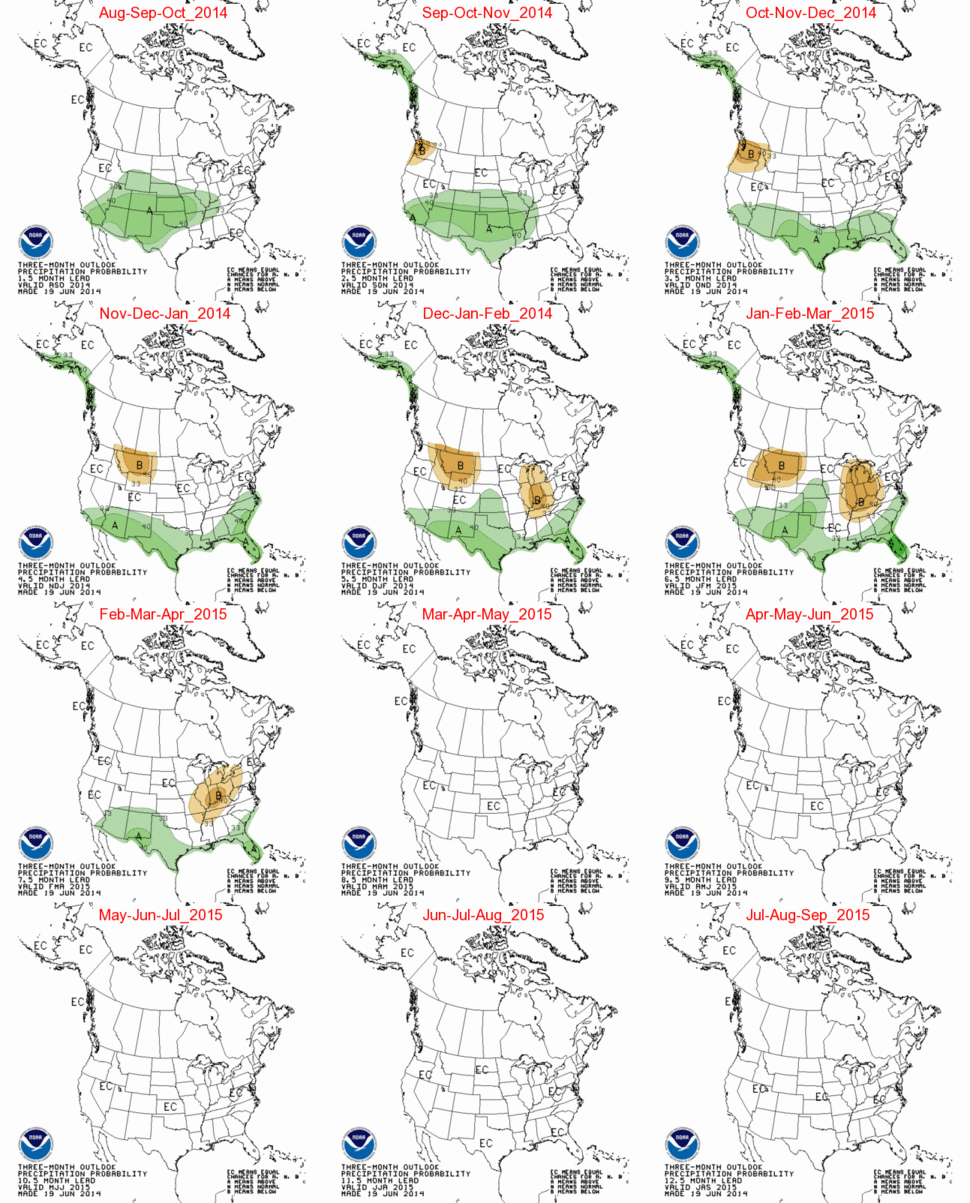
The more interesting maps are the long term ones:

courtesy CPC

courtesy CPC

You can see that for the lower part of the Colorado River Basin (where I live in New Mexico, yay!) odds are clearly tilting toward a wetter winter, based on the growing chances of an El Niño. But you can see from these maps the way El Niño really isn’t a strong predictor, one way or the other, for the primary watersheds that feed the Colorado River.

Here’s some great background via Paul Miller regarding El Niño and Colorado River runoff.

Arizona goes all in on its Lower Colorado risk move

Michael Wines of the New York Times joins the discussion as Arizona officials continue to push their new message about the risk of shortage on the lower Colorado:

Although experts have been aware for years that shortages would eventually occur, the analysis represents a marked turnabout in officials’ thinking.

“We’re dealing with a very serious issue, and people need to pay attention to it,” Sharon Megdal, a University of Arizona water expert and board member of the Central Arizona Project, said in an interview. “The possibility of cutbacks of water deliveries to municipalities is higher than we’ve ever thought it was going to be.”